
Microbial network analysis is an acceptable approach to investigating microbiome and metagenomic datasets and finding insights into a complex ecosystem. Ye Deng et al. introduced an integrated pipeline, iNAP, for network construction and visualization to help researchers understand microbial ecology without prior knowledge of bioinformatics or statistical programming skills.
Understanding and deducing information from microbial communities has always been a tedious process for researchers across the globe. The complexity of these microbiomes has provided hanging questions that may seem difficult to answer. The new age of technology, high-throughput sequencing, and metagenomics analysis has eased traditional studies. However, these still lack conjoint efforts of bioinformatics and statistical tools to employ the huge data to benefit the human race by understanding the keystone organisms among the explored ecosystems.

Image Source: 10.1002/imt2.13
Identifying the gaps, researchers from the Chinese Academy of Sciences have introduced iNAP: an easy-to-use integrated network analysis pipeline to comprehensively determine the intra- and inter-domain association of microbial ecologies. The pipeline integrates molecular ecological networks (MENs) and interdomain ecological networks (IDENs) from microbiome abundance data (such as OUT, species, etc.) and implies multiple statistical methods such as MENA (RMT based Pearson/ Spearman’s correlation), SparCC (compositional data using python package), eLSA(Extended local similarity analysis using python package), SPIEC-EASI (Sparse inverse covariance estimation using python and R script). The integrated network using network construction and network visualization also provides approaches to studying the abiotic factors.
iNAP: Workflow
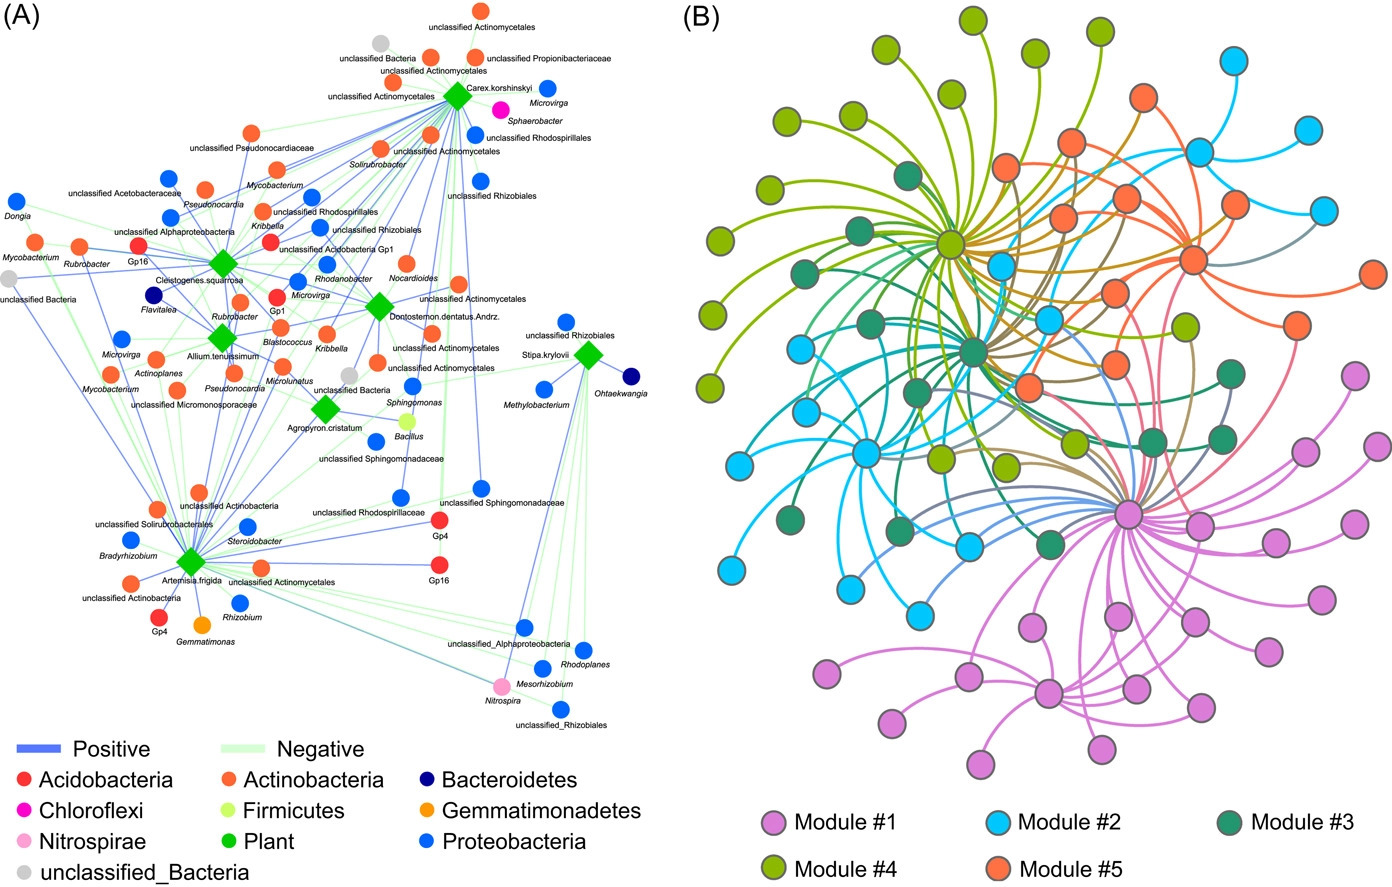
Implementing network construction methods, microbiome analysis is performed to understand ecological networks (intra-domain and inter-domain). The pipeline uses an adjacent network matrix and a bipartite network matrix to show the relationships for intradomain and interdomain groups of genus and species. Therefore, MENs and IDENs display the potential associations of species within complex microbial communities, and the topological network structures could reflect some interdependence and ecological implications, for example, modular structure to indicate similar functions.
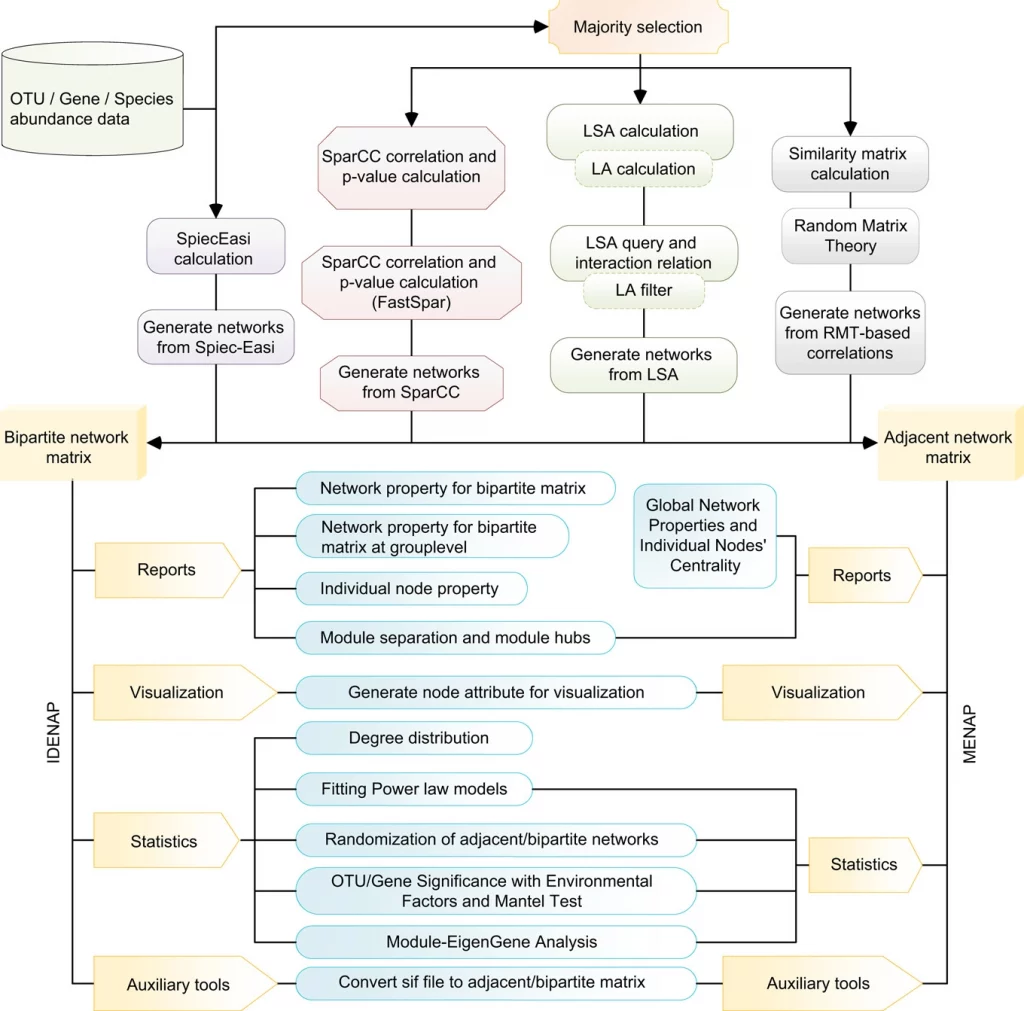
Image Source: 10.1002/imt2.13
- Network Construction
The pipeline focuses on one or two groups of species. Group 1 comprises bacteria, archaea, fungi, and protists, and Group 2 comprises plant-microbe and bacteria-fungi. These associations can be separated into the adjacent matrix and bipartite matrix. Where molecular ecology networks (MENs) define an adjacent matrix, and interdomain ecological networks (IDENs) define a bipartite matrix.
The input files can be tabular, abundance datasets, metadata, and taxonomy files using statistical approaches. For example, the authors have provided an exemplary network construction procedure for the interdomain ecological network analysis pipeline (IDENAP).
The SparCC is one such method that utilizes majority selection, SparCC correlation, and p-value calculation and generates networks from SparCC. The primary procedure includes keeping prevailing species across various samples. The minimum requirement of iNAP network construction requires eight samples’ replicates. Followed by using the default parameters to calculate the correlation values of SparCC, and the output format for construction analysis can be adjusted accordingly, with different visualization approaches, that is, Gephi or Cytoscape software.
- Network Analysis
The procedure for network analysis involves various inputs to generate outputs for network property for bipartite matrix, network property for bipartite matrix at group level, individual node property, module separation and module hubs, degree distribution, fitting power law models, randomization of bipartite networks, OTU/Gene significance with environmental factors and mantel test, module-EigenGene analysis, generating node attribute for visualization.
For network construction and visualization, iNAP provides two software platforms: Cytoscape and Gephi. The Cytoscape files are available in three file types that can be found in the integrated pipeline iNAP, the format of files available are one file (.sif), one node attribute file (.txt), and one edge attribute file (.txt). Files formatted in a similar way to the three provided ones can also be imported.
Similarly, for Gephi the pipeline provides 2 file options one node attribute file (.csv) and one edge attribute file (.csv) to show node features within the constructed network.
iNAP Applications
The entirety of the integrated network analysis pipeline is based on using the galaxy network, which is easy to use. This helps users to use the pipeline for analysis using any prior knowledge of bioinformatics tools and statistical programming skills.
Users can effectively use it to get network topological features and explore microbial communities to find stable patterns of the ecosystem, which are mediated by keystone organisms. The pipeline also allows randomization of networks which can help link environmental traits or abiotic factors, for example, mantel tests and EigenGene analysis.
While iNAP, is designed and maintained in SAFE (Stability-Accessibility-Feasibility-Easiness) mode. It also provides a set of troubleshooting, possible reasons, and solutions for better research accessibility.
Final Thoughts
iNAP is one of the most sought integrated network analysis pipelines to decipher microbiome ecology. Its robustness and simple handling can provide researchers ease in choosing and employing huge datasets. Not only intradomain species relationships but also the interdomain species associations within microbial communities, for example, the hierarchal structure of multiple trophic microbes in all niches. Administering statistical methods, microbial network analysis has displayed better topological research as seen in crosstrophic analysis among prokaryotes, fungi, and cercozoans, similarly constructing python-zooplankton network change across various demographics. The team has also addressed tutorials to assist in the easy use of new users.
Article Source: Paper Reference | Available Online: iNAP
Learn More:
Top Bioinformatics Books ↗
Learn more to get deeper insights into the field of bioinformatics.
Top Free Online Bioinformatics Courses ↗
Freely available courses to learn each and every aspect of bioinformatics.
Latest Bioinformatics Breakthroughs ↗
Stay updated with the latest discoveries in the field of bioinformatics.

Mahi Sharma is a consulting Content Writing Intern at the Centre of Bioinformatics Research and Technology (CBIRT). She is a postgraduate with a Master's in Immunology degree from Amity University, Noida. She has interned at CSIR-Institute of Microbial Technology, working on human and environmental microbiomes. She actively promotes research on microcosmos and science communication through her personal blog.


