
Identifying the complex molecular changes underlying diverse diseases remains a grand challenge in biomedicine. While high-throughput omics technologies have enabled unbiased interrogation of disease perturbations, making sense of the data deluge to pinpoint key drivers and biomarkers is no trivial task. This is where disease molecular signatures come in – sets of genes, proteins, or metabolites that can serve as diagnostic or prognostic markers for specific conditions. To empower researchers to discover and compare signatures across diseases, researchers from Chongqing Medical University, China, developed DiSignAtlas – a new knowledgebase of transcriptomic signatures spanning over 1800 disease types.
The Critical Need to Map Disease Molecular Signatures
Molecular signatures play an indispensable role in translational research and precision medicine by enabling diverse applications:
- Diagnosis and early detection – Signatures can detect diseases in early stages for timely intervention, as well as diagnose ambiguous presentations.
- Prognosis and predicting outcomes – Certain signatures may indicate prognosis, anticipated severity, and treatment response.
- New therapies – Mapping affected pathways guide drug target identification. Signatures also aid in repurposing existing drugs.
- Mechanistic insights – Linking phenotypes to genotype alterations provides insights into downstream functional impacts.
- Disease models – Signatures inform suitable cell lines and animal models that recapitulate aspects of human pathophysiology.
- Biomarker identification – Screening altered molecules facilitate the discovery of non-invasive diagnostic and prognostic biomarkers.
Despite these pressing needs, obtaining cohesive views of disease signatures has been extremely challenging. While thousands of studies report disease-associated genes and pathways, results are often inconsistent and focused on individual molecules. Experimental biases, limited sample sizes, and varying methods undermine reproducibility. The lack of signature standardization also makes integrative analyses difficult.
Omics technologies like microarrays and RNA sequencing empower unbiased, holistic characterization of disease-induced molecular alterations. But compiling signatures from thousands of scattered studies and making sense of the data deluge remains an uphill battle. Although resources like GEPIA aggregate cancer genomic data, no centralized portal existed for molecular signatures across diverse diseases prior to DiSignAtlas. This fragmented state of disease molecular data has severely impaired comparative analyses and knowledge mining.
Introducing DiSignAtlas – A Compendium of Transcriptomic Signatures Across Diseases
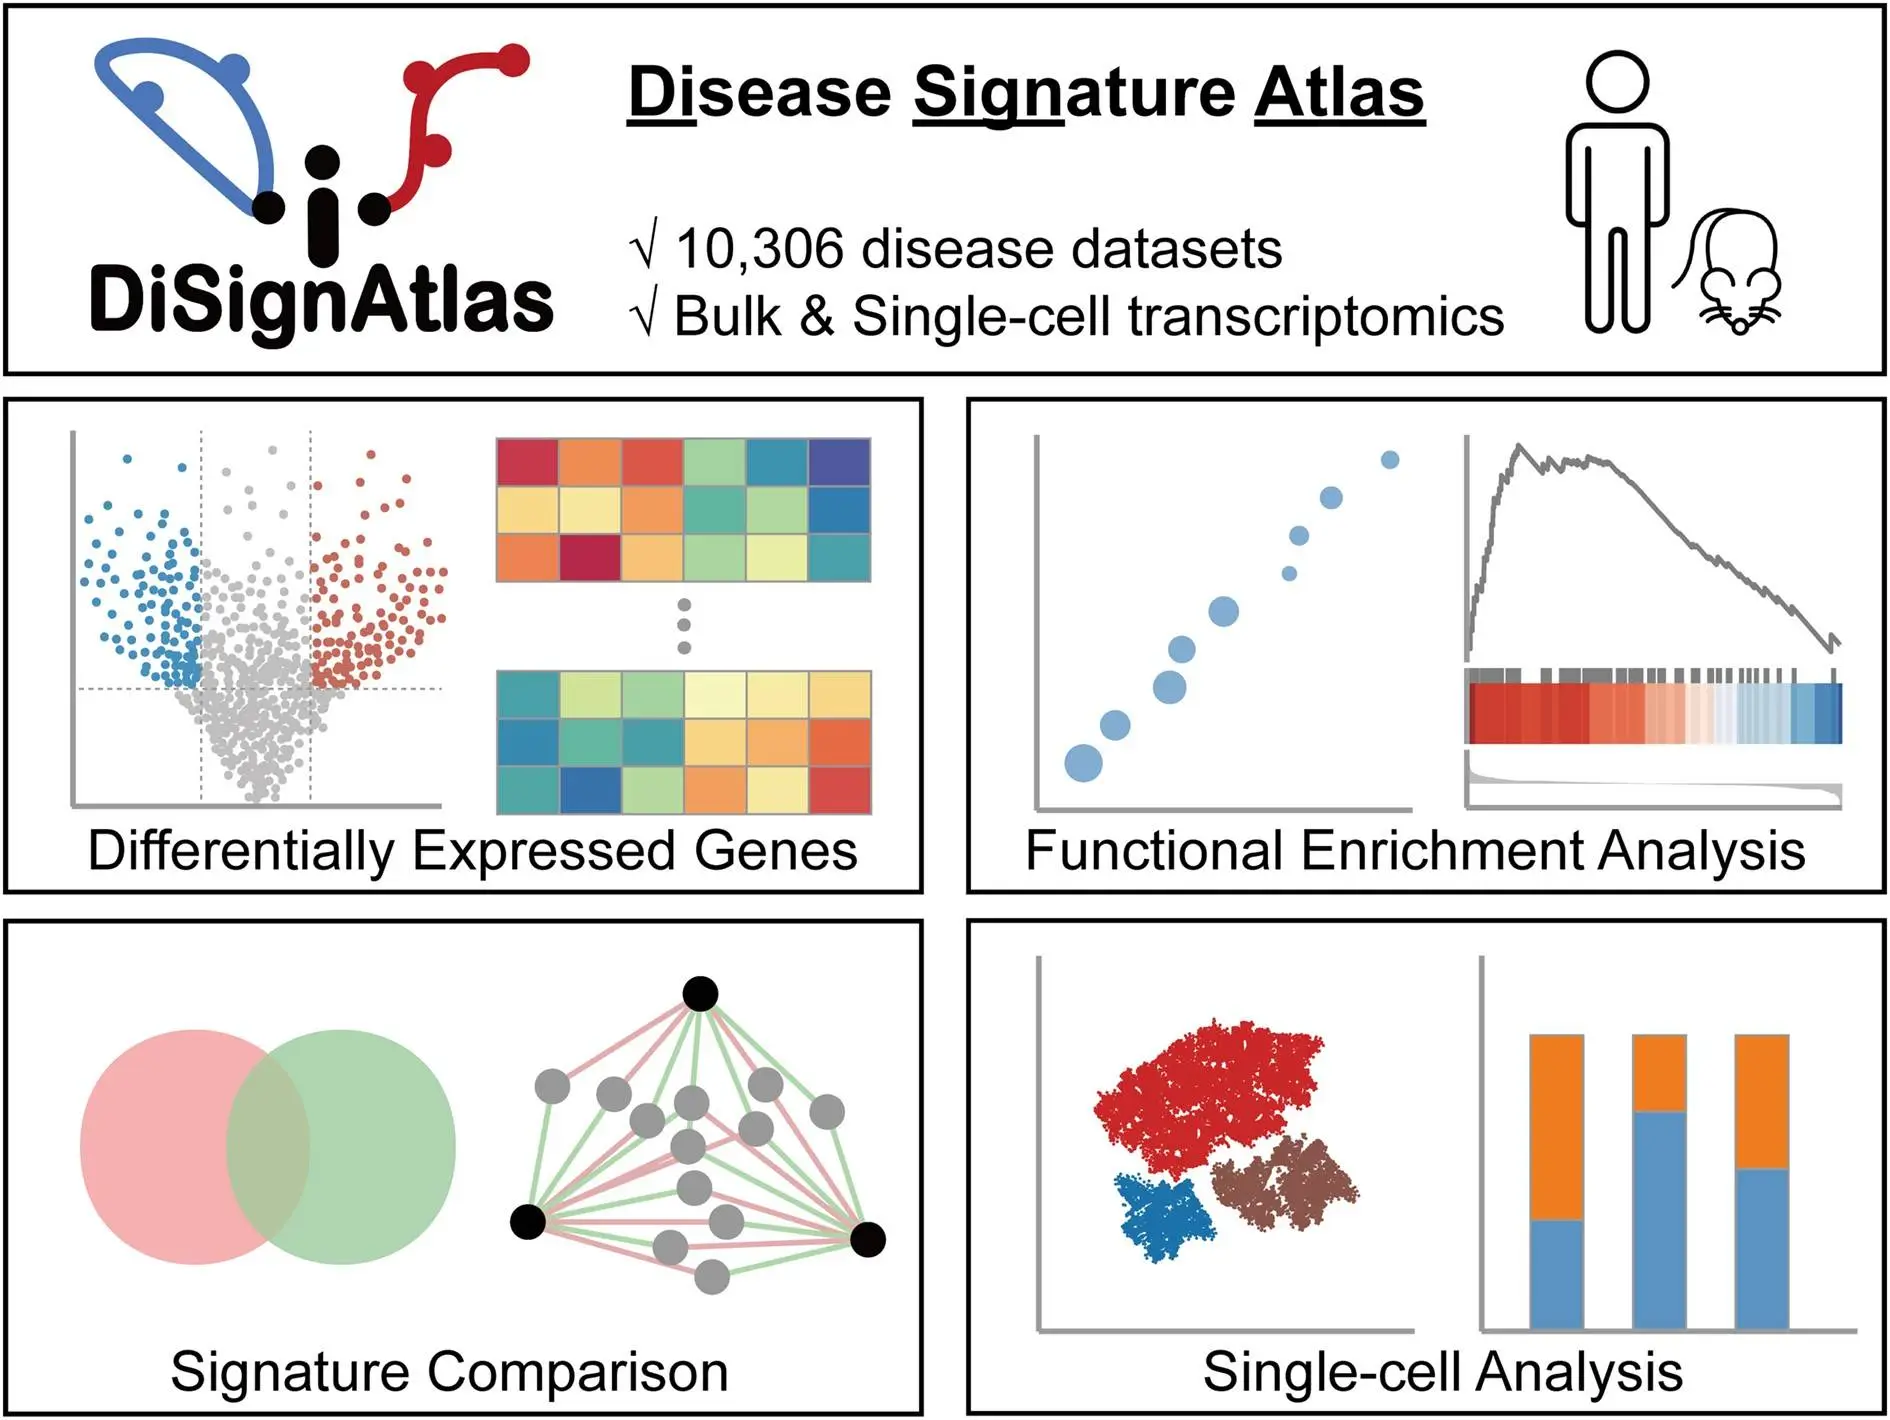
To address this unmet need, the researchers developed DiSignAtlas, currently the most comprehensive database available of transcriptomic signatures for diverse diseases. DiSignAtlas’s general workflow comprised: (i) data was collected from GEO, ArrayExpress, and TCGA databases and processed using various tools, including limma, DESeq2, edgeR, SCTransform, ScType, and Seurat. (ii) Differentially Expressed Genes (DEGs) were identified using a significance threshold of adjusted P-value < 0.05. (iii) Enrichment analysis was performed using the R package ClusterProfiler to identify enriched regulatory transcription factors, GO terms, KEGG pathways, and gene sets. (iv) Signature comparisons were performed using hypergeometric tests to assess the significance of overlap between signatures within the DiSignAtlas dataset and between DiSignAtlas signatures and user-submitted gene sets.
This immense data resource enables the querying of transcriptomic signatures using flexible options like disease names, tissues, individual genes, ontologies, and model systems. Users can browse hierarchically organized disease trees and tag clouds for intuitive exploration. DiSignAtlas also empowers various analytical workflows to compare signatures, find models, uncover connections, and gain biological insights. Overall, it provides the molecular lens needed to view human diseases in a new light and transform our understanding of their biology.
The Remarkable Scale and Scope of DiSignAtlas
To appreciate the scale of the knowledgebase, DiSignAtlas contains:
- 181,434 transcriptome profiles from humans and mice
- 1836 distinct disease types represented
- 10,306 curated comparative datasets containing both disease and healthy samples
- 328 datasets from single-cell RNA-sequencing studies
- Over 5 million differentially expressed genes identified as signatures
Such extensive coverage enables researchers to explore common conditions like diabetes and rare diseases often ignored in siloed datasets. Human and mouse data integration also allows leveraging model systems to elucidate mechanisms. Single-cell data permits scrutiny of cell-type specific perturbations beyond average bulk tissue responses. The unified signatures transcend the inconsistencies between individual studies, providing core consensus on molecular alterations linked to phenotypes.
DiSignAtlas thus constitutes the most comprehensive available resource of curated disease transcriptomes. Its unified signatures empower holistic big-picture perspectives not feasible from disjointed studies. Let us now examine how researchers can utilize this invaluable database.
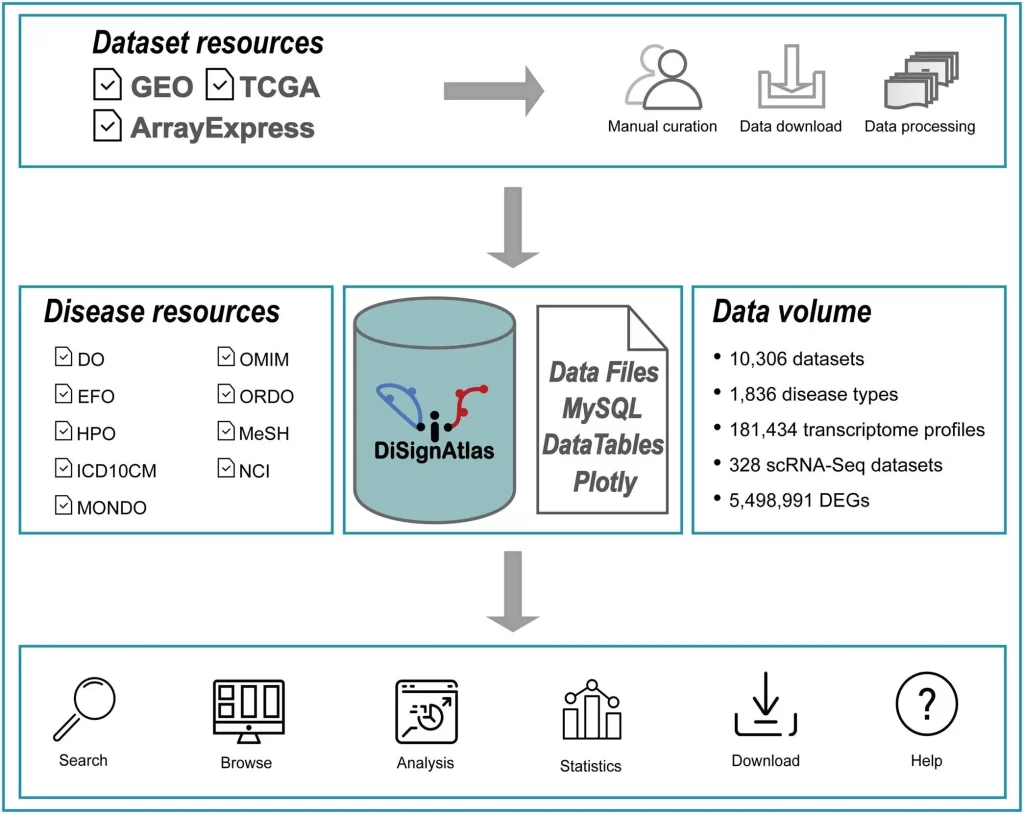
Image Source: https://doi.org/10.1093/nar/gkad961
Navigating DiSignAtlas to Uncover Disease Insights
DiSignAtlas offers an intuitive interface to query, analyze, and visualize transcriptomic signatures across diseases:
Search – Users can search datasets and signatures using flexible fields like disease names, tissues, individual genes, ontologies, model systems, and more. Keyword searches across these parameters rapidly retrieve relevant datasets.
Browse – Hierarchically organized disease trees enable drilling down disease categories and visually exploring relationships. Tag clouds also showcase disease prevalence across the database.
Analyze – Tools are provided to compare user gene lists vs. DiSignAtlas signatures, find diseases enriched for user lists, and identify overlaps between disease datasets.
Visualize – Interactive tables, boxplots, volcano plots, and heatmaps help visualize DEG expression patterns, enrichments, pathway networks, and other outputs.
Compare – Ortholog mapping enables comparison of human and mouse signatures to identify conserved mechanisms and models.
Download – Datasets, signatures, upstream analysis code, and raw expression profiles can be downloaded for offline analysis.
For example, a simple search for “influenza” instantly retrieves all relevant studies. Analyzing overlapping signatures reveals several consistent interferon-induced genes as biomarkers. Pathway enrichment highlights critical processes dysregulated during infection, like antiviral responses. Finding appropriate mouse models for further study is also straightforward. These capabilities exemplify how DiSignAtlas can elucidate biological insights into human diseases.
Diving Deep into Signatures on Disease Pages
When users click on a particular disease dataset, they are taken to detailed pages providing a wealth of information, which comprise:
Disease overview – Key metadata like disease name, affected tissues, definitions, external database links, and model organism relevance.
Top differentially expressed genes – Tables of top DEGs with interactive boxplots, volcano plots, and heatmaps to inspect expression patterns.
Upstream regulators – Transcription factor enrichment results implicate possible upstream regulatory mechanisms.
Downstream functions – Pathway and cell type enrichments pinpoint biological processes and cell populations impacted by the disease.
Inter-disease connections – Network graphs display DEG overlaps with correlated diseases, highlighting common mechanisms.
Single-cell analytics – For scRNA-seq data, analytical tools like cluster analysis, cell type annotation, and cell ratio shifts.
For instance, the influenza disease page provides immediate access to top DEGs from various studies, enriched pathways like viral response processes, overlaps with related diseases, and details of affected respiratory cell types. Such functionality makes exploratory analysis seamless.
Employing Comparative Analysis to Derive Biological Insights
One of the most powerful aspects of DiSignAtlas is the ability to systematically compare signatures across diseases and species:
- Inter-disease connections – Identify common or divergent mechanisms by analyzing DEG overlaps.
- Disease models – Match human signatures to mouse models by comparing orthologous DEGs.
- Conserved mechanisms – Homologous DEGs implicate core pathways disrupted across species.
- Biomarkers – DEGs consistently perturbed across diseases may represent biomarkers reflecting general response processes.
For example, identifying concordant influenza signatures in mice and humans facilitates the selection of appropriate models for further studies. Overlaps with coronavirus infections highlight shared antiviral response genes. Conserved cell type perturbations also emerge, like epithelial cell effects across respiratory conditions. Such comparative analyses yield biological insights challenging to glean otherwise.
Future Outlook and Directions
DiSignAtlas provides an invaluable framework for exploring disease transcriptome alterations in a structured fashion. Some future directions include:
- Regular updates with expanding data and disease coverage.
- Incorporation of multi-omics signatures encompassing proteins, metabolites, etc.
- Additional analytical tools for network analysis, visualization, and data integration.
- Improved disease models based on comparative analyses across humans and mice.
- Clinical applications like biomarker discovery and drug repurposing utilizing conserved signatures.
- Incorporation of text mining and automated curation approaches to accelerate data accumulation.
- Extension to other common model organisms beyond mice, like fruit flies and zebrafish.
- Platforms for crowdsourced data contributions and evaluation to further enhance curation.
- Integrative frameworks to link transcriptomic changes to upstream genetic drivers.
By providing the scaffold to map molecular alterations across thousands of disease conditions, DiSignAtlas aims to shed light on the intricate circuitry that goes awry in diverse pathologies. It represents an indispensable resource for translational researchers and clinicians seeking to understand diseases, develop predictive diagnostics, and usher in a new era of precision medicine. The future of data-driven healthcare hinges critically on integrated bioinformatics platforms like DiSignAtlas that transform fragmented data into cohesive biomedical knowledge.
Case Study: Elucidating Influenza Pathogenesis Mechanisms with DiSignAtlas
To demonstrate the practical utility of DiSignAtlas, let us walk through an example case study focused on influenza, a common respiratory viral infection. Influenza remains a major public health concern due to yearly outbreaks and the potential for more virulent pandemic strains. However, many aspects of its pathogenesis remain unclear.
Objective – Leverage DiSignAtlas to elucidate molecular mechanisms, biomarkers, and appropriate mouse models to study influenza infection.
Search – A simple keyword search for “influenza” in DiSignAtlas returns 118 matched human datasets.
Overlap Analysis – Finding common DEGs across ≥8 of the datasets reveals 18 shared genes. Many are interferon-induced antiviral mediators (IFI27, IFI35, IFI44L, IFIT1, IFIT3, IFITM3) that represent robust markers of infection.
Dataset Details – The page for dataset DSA08144 shows “viral process” as the top enriched pathway. “Response to virus” is the top enriched GO term. IFITM3 is among the top DEGs, confirming its conserved role.
Models – 9 and 2 of the top 10 correlated human and mouse datasets, respectively, are influenza-related, confirming mice effectively model human disease.
Insight – This brief analysis already reveals key antiviral signatures, promising diagnostic markers, relevant mouse models, and mechanisms involving interferon response pathways – demonstrating the tremendous value of structured disease transcriptome data in DiSignAtlas for researchers.
Conclusion
DiSignAtlas provides the most comprehensive available collection of curated disease transcriptomic signatures, enabling comparative analyses and biological insights that are difficult to obtain otherwise. By illuminating molecular commonalities and differences across diverse conditions, it is poised to accelerate diagnosis, prognosis, treatment selection, and mechanism elucidation. DiSignAtlas represents an invaluable open-science resource for propelling discovery and medical innovation. DiSignAtlas is anticipated to rapidly become an indispensable part of every translational researcher’s toolkit, catalyzing major progress in understanding devastating diseases affecting humanity and developing more precise interventions to combat them.
Article source: Reference Paper | DiSignAtlas is available at the Website
Learn More:


Dr. Tamanna Anwar is a Scientist and Co-founder of the Centre of Bioinformatics Research and Technology (CBIRT). She is a passionate bioinformatics scientist and a visionary entrepreneur. Dr. Tamanna has worked as a Young Scientist at Jawaharlal Nehru University, New Delhi. She has also worked as a Postdoctoral Fellow at the University of Saskatchewan, Canada. She has several scientific research publications in high-impact research journals. Her latest endeavor is the development of a platform that acts as a one-stop solution for all bioinformatics related information as well as developing a bioinformatics news portal to report cutting-edge bioinformatics breakthroughs.


