
The Kyoto Encyclopedia of Genes and Genomes (KEGG) database serves as an invaluable resource for systems biology research across diverse fields. It provides comprehensive information on pathways, modules, and networks encompassing genes, proteins, enzymes, compounds, and reactions. While native KEGG tools enable network visualization and analysis, software limitations persist regarding flexible manipulation and integration of KEGG data. To address this, scientists from the University of Tokyo, Japan, developed ggkegg, an R package integrating KEGG with the ggplot2 grammar of graphics framework for enhanced visualization and analysis.
Streamlining KEGG Network Analysis
One key feature of ggkegg is taking KEGG data and putting it into tidygraph networks. This makes the data easier to manipulate and visualize. All the pathway information can be accessed in one tidygraph object. For example, compound groups are parsed by adding IDs for the compounds and showing their relationships.
Building on this tidygraph structure, ggkegg can calculate importance measures like centrality degree for nodes and edges. It can then show these visually, like by changing node size based on degree. Importantly, ggkegg can parse not just pathways but also modules and networks. This allows integrated analysis of multiple KEGG components.
Customizable KEGG Data Visualization
ggkegg aims to leverage ggplot2’s grammar of graphics for flexible KEGG visualization. Functions enable adding rectangular nodes, simplifying grouped nodes/edges, and projecting external networks onto KEGG maps for comparison. The researchers also enable projecting ggraph visuals onto KEGG images, permitting direct ggplot2 layer application to native graphics.
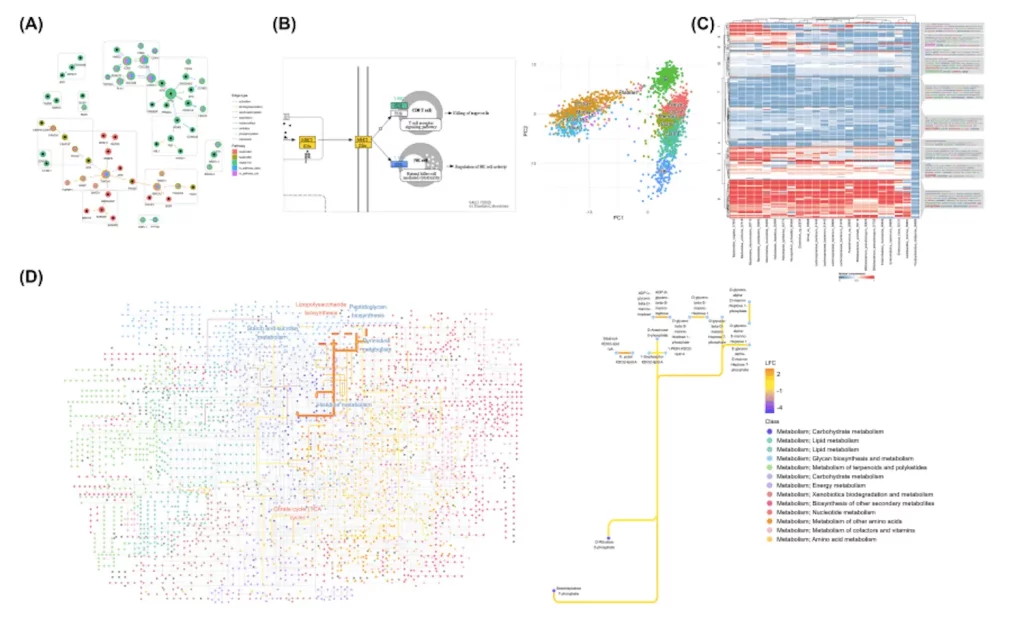
For inter-pathway analyses, ggkegg allows arranging native maps in panels or custom layouts to examine cross-pathway node roles. Global metabolism maps can also be depicted, incorporating KEGG ORTHOLOGY (KO), compound, and reaction data. These maps facilitate analyzing experimental data like differential abundance in microbiome studies. ggkegg also enables converting KEGG identifiers to preferred labels (e.g., gene symbols) for customizable, publication-ready graphics.
Integration with Omics Analysis Packages
To enable seamless integration with omics workflows, ggkegg offers functions to incorporate analysis data like expression matrices into KEGG graphs for network-based assessments. For example, DESeq2 differential expression outputs can be directly visualized on pathways. Enrichment analysis results from clusterProfiler can also be rendered, allowing the interpretation of enriched pathways based on experimental data.
Utilities for Functional Assessments
Beyond visualization, ggkegg provides utilities to compute module completeness, abundance, and pathway abundances based on input KO data. This allows quantitatively examining modular functions and comparing pathway presence across groups. The package facilitates both KO presence/absence evaluation and functional capability comparisons.
Applications in Transcriptomic and Microbiome Studies
The researchers demonstrate ggkegg’s utility through examples applying it to analyze transcriptomic and microbiome data. In transcriptomics, it allows simultaneously visualizing enrichment results from multiple datasets, like depicting commonly enriched pathways in BK polyomavirus infection models. For single-cell analyses, it enables mapping cluster markers onto pathways to elucidate their functional significance.
In microbiome research, ggkegg facilitates comparing species’ metabolic capabilities using module completeness. It also enables metabolic functional analysis by mapping differentially abundant KOs between groups onto global maps. This assists in elucidating how key microbial KOs distribute across pathways.
Conclusion
ggkegg enables flexible integration of KEGG resources with state-of-the-art R packages for enhanced network analysis and visualization. It empowers researchers to leverage KEGG data for insightful investigation of complex biological systems and effective communication of findings. Combined with its extensive documentation and usage examples, ggkegg can greatly accelerate diverse omics studies relying on KEGG databases.
Article source: Reference Paper | The package and user documentation are available on GitHub
Learn More:


Dr. Tamanna Anwar is a Scientist and Co-founder of the Centre of Bioinformatics Research and Technology (CBIRT). She is a passionate bioinformatics scientist and a visionary entrepreneur. Dr. Tamanna has worked as a Young Scientist at Jawaharlal Nehru University, New Delhi. She has also worked as a Postdoctoral Fellow at the University of Saskatchewan, Canada. She has several scientific research publications in high-impact research journals. Her latest endeavor is the development of a platform that acts as a one-stop solution for all bioinformatics related information as well as developing a bioinformatics news portal to report cutting-edge bioinformatics breakthroughs.


