

Scientists from Prague have developed MZmine3, a scalable platform for the analysis of mass spectrometry (MS) data from different instrumental setups. The platform supports hybrid datasets from various setups such as liquid and gas chromatography (LC and GC)-MS, ion mobility spectrometry (IMS)-MS, and MS imaging. Spatial metabolomics analyses with increased annotation confidence is now feasible by the integration of IMS-MS imaging and LC-IMS-MS datasets. MZmine3 is an improvement from the previous versions MZmine and MZmine2 in terms of providing an integrative workflow combining both LC-IMS-MS and MS data, hybrid datasets, for spatial metabolomics analyses.
The predecessors to MZmine3, and why do we need MZmine3?
The rapid growth in innovation in mass spectrometry, coupled with the increased sensitivity and throughput of mass spectrometry instrumentation, calls for the development of advanced data processing tools. Since its inception in 2004, the MZmine project was developed for the processing and visualization of mass spectrometry-based molecular profile data. MZmine is a cross-platform software that can be used on personal computers as well as high-performance computers for robust, reproducible as well as scalable data analysis. The project has been under continuous development and has seen community additions to the existing parent software, which include performant feature detection workflows and lipid annotation modules. MZmine lacked a modular architecture for the framework, which made it difficult to expand the platform to accommodate the new methods that were being developed by the scientific community.
MZmine2 was developed to deal with this lack of modularity of the parent MZmine software. The framework architecture was rebuilt into a modular structure in the new version. Several new visualization tools were implemented in this release. The release also included a new and efficient peak list alignment method in the modular workflow.
The current version, MZmine3, is an improvement over the previous versions in terms of performance, as has been shown by the authors. Due to the ever-increasing size of raw data being produced, the main improvement of MZmine3 is in its scalability. With the aid of efficient memory management and parallelization techniques, MZmine3 was seen to remove bottlenecks. This resulted in 89% reduced processing time compared to MZmine2 for 250 dissolved organic matter samples.
Overview of the integrative platform for MS data analysis: MZmine3
Recent developments in MS instrumentation have led to increased data volume and complexity. These advancements in instrumentation technology require new acquisition modes like parallel accumulation serial fragmentation (PASEF). Combining IMS with imaging, which has been shown to improve MS imaging annotation quality, is also made possible now. The three main metabolomics data repositories, viz, MassIVE/GNPS, MetaboLights, and Metabolomics Workbench, clearly highlight the growing number of large-scale cohort and multifactorial studies in environmental, clinical as well as other fields. However, a scalable, reproducible as well as flexible workflow for data analysis of combined MS data from multiple sources was not available until now. Thus, the authors developed the next iteration of the release version MZmine3, the integrative analysis framework for multimodal MS data analysis.
Overview of active developments and key additions to MZmine since its inception.
- Over 180 modules have been added that enable interactive, reproducible data processing as well as visualization in the current version of MZmine3.
- Downstream analysis with projects like GNPS, SIRIUS, and MetaboAnalyst has been made possible with data exchange formats and direct interfaces.
- Feature detection in retention time (RT), ion mobility, and m/z dimension to MS data is applied to open or vendor-stored formats.
- An aligned feature list, as well as annotation results, are also available.
The following figure is an illustration of the above points.
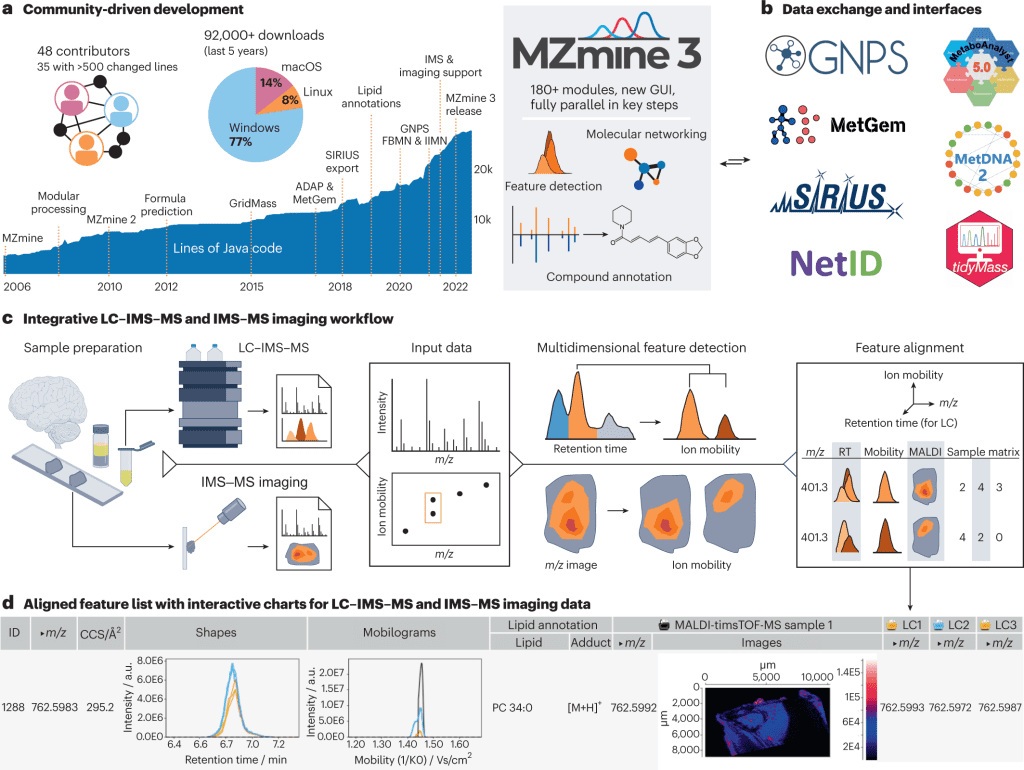
Image source: https://doi.org/10.1038/s41587-023-01690-2
The new users can access the MZmine website for detailed manuals and video tutorials. In addition, starting points for various standard workflows and mass spectrometer types are provided by the new processing wizard of MZmine.
Conclusion
The authors developed and released the latest version, MZmine3, of the widely used cross-platform MZmine software. The second iteration MZmine was a great improvement in terms of introducing modularity to the framework of the workflow, thereby enabling the addition of community-developed methods for the analyses of MS data. Although the second version was a great improvement, it lacked the capability to analyze and visualize multimodal MS data derived from multiple mass spectrometry instruments. With the advent of innovations in MS instrumentation technologies, large volumes of multimodal data have been generated, with requires an integrated framework for the analysis of such hybrid datasets. MZmine provides the much-needed integrative platform for multimodal spatial metabolomics data analysis as well as visualization. The integration of IMS-MSimaging and LC-IMS-MS datasets paves the way for spatial metabolomics analysis with increased efficiency and annotation confidence.
Article Source: Reference Paper | MZmine3: Website | Source Code: GitHub
Learn More:


Banhita is a consulting scientific writing intern at CBIRT. She's a mathematician turned bioinformatician. She has gained valuable experience in this field of bioinformatics while working at esteemed institutions like KTH, Sweden, and NCBS, Bangalore. Banhita holds a Master's degree in Mathematics from the prestigious IIT Madras, as well as the University of Western Ontario in Canada. She's is deeply passionate about scientific writing, making her an invaluable asset to any research team.


Hi Prof.,
Many thanks for your outstanding efforts here.
Currently, I am working on isolation of bioactive ingredients from natural products. I have obtained LC chromatograms at 210, 254, 280, and 304 nm along with the corresponding MS data for the respective peaks. However, I don’t know how to identify the compounds represented by the peaks. Please, is MZmine3 a right software for me to decipher my present research questions?
I thank you, again, for your efforts.
Jerry.
Hi Jerry,
Thanks for contacting us! Peak identification modules of MZmine3 may help in your analysis, but we would recommend contacting MZmine3 support to get more accurate information because all the credit for the research goes to the authors and developers of MZmine3.
You can contact MZmine3 support by visiting the below link:
https://mzmine.github.io/support.html#Issues
Hope this will help!