
Recent developments in comparative genomics studies, along with the availability of cutting-edge computational tools, have revived the study of evolutionary biology and genetics in a new way. Existing computational tools can efficiently interpret orthologous clusters of genes and determine phylogenetic relationships among species. The recently upgraded release of the Web-based program OrthoVenn, called OrthoVenn3, with added features like better visualization ability, efficient orthologous cluster identification, etc., has created new possibilities for comparative genomics research.
Comparative Analysis of Orthologous Gene Clusters
Genome-based analysis of orthologous clusters is crucial for understanding comparative genomics. The orthologous genes originate from a single gene of the last common ancestor. Studying orthologous genes can help in the taxonomic and phylogenetic classification of an organism. Advancements in sequencing technologies have delivered vast genome sequences from various organisms across species. This has helped in analyzing orthologous clusters by performing whole-genome comparative analysis.
Recap of OrthoVenn and its Versions
In 2015, the first version of OrthoVenn was released to identify and analyze genome-wide orthologous clusters using Venn diagrams. Venn diagrams display the relationship between species using circles. It can identify individual as well as overlapping genes for different species. The data thus generated can identify isolated and shared gene clusters for species. Its major drawback was that it could compare up to six species at once because of its design. It lacked both computational and visualization capabilities.
Subsequent versions of OrthoVenn (OrthoVenn1 and OrthoVenn2) were released, keeping these shortcomings in mind. The updated features allowed users to compare genes for more than six species. The updated version was designed with improved computational ability to carry out additional comparisons, which were missing in the previous versions. The successive versions were both faster and more accurate.
OrthoVenn2, a standalone version, was designed to compare orthologous gene cluster analysis for 12 species at once. It was redesigned to use Venn diagrams as well as use tables to display genetic analysis. For each cell in the table, rows represented a group of orthologous clusters, and columns represented the species that was being studied. OrthoVenn2 was also designed to perform motif analysis and create a phylogenetic tree using the MEME (Multiple Expectation Maximizations for Motif Elicitation) Suite.
OrthoVenn3 and its Features
The recently launched OrthoVenn version, OrthoVenn3, contains several added features to the previously existing ones. The updates made can improve the performance of comparative genome analysis. Several changes were made to its algorithms to improve its functionality, like:
1) Increasing its input data capacity to add more species for analysis at once.
2) Enhancing its accuracy in inferring orthologous clusters using another web-based platform, OrthoFinder2.
3) Including a visualization tool for quantitative analysis called UpSet. The UpSet tool is designed to analyze data for more than six sets, compared to Venn diagrams, which could analyze up to three or a maximum of four sets of data.
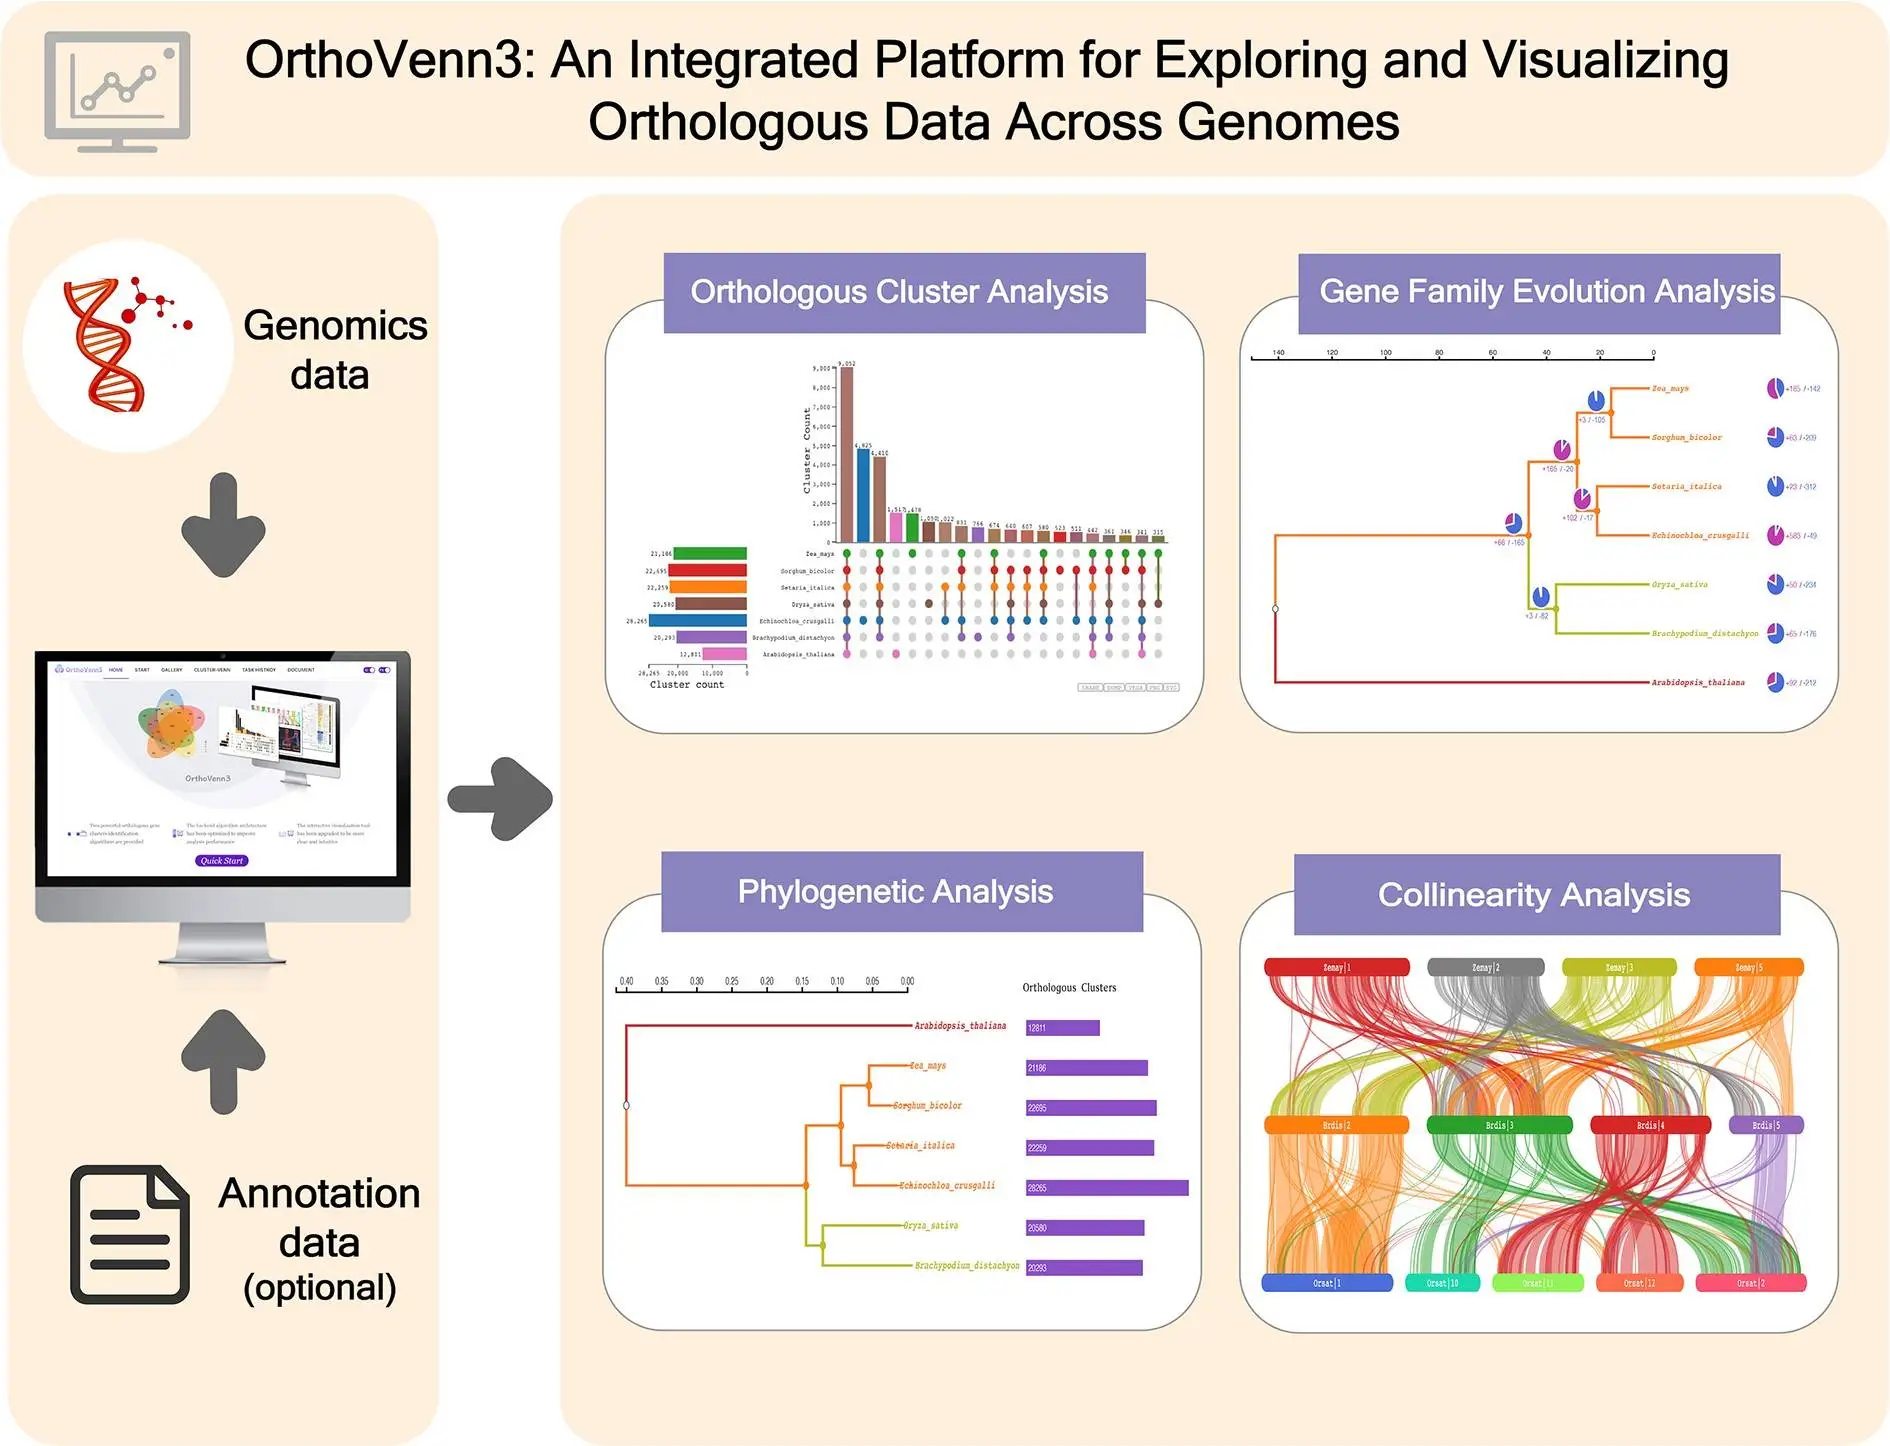
OrthoVenn3 also included several additional features to increase its efficiency in performing genome analysis. 1) OrthoVenn3 has incorporated phylogenetic analysis algorithms that allow for the identification of evolutionary relationships between species under consideration based on the presence of orthologous clusters. 2) An analysis of genetic events like gene family contraction and diversification was included. This analysis can help examine and identify the possible gain or loss of genes or gene families for species due to evolution. Gene contraction refers to the deletion of mutated gene copies that arise in the course of evolution to keep gene families from diverging. 3) Performing collinearity analysis to study evolution and recognize regions undergoing genomic realignment.
OrthoVenn3 Working
OrthoVenn3 takes protein sequences as inputs in standard Fasta format and provides a multitude of outputs like a Venn Diagram for less than three sets of species, an UpSet table for larger sets, a phylogenetic tree, collinear graphs, and an occurrence table based on the type of data input and constraints selected. Scientists can perform reliable and extensive comparative genome analysis and identify evolutionary relationships and genetic variations for different species based on the protein sequence.
The OrthoVenn3 has an easy-to-use search option and allows fast and efficient data retrieval options. It has a database of its own to store protein sequences along with additional genetic information. The accuracy of the data in the database is maintained by regular updates.
The workings of OrthoVenn3 can be summed up as follows:
1. Identification of orthologous clusters and result visualization.
OrthoVenn3 uses the OrthoFinder2 tool to increase its efficiency in identifying orthologous clusters. The generated data can be visualized using UpSet tables due to its ability to analyze vast sets at once in comparison to the limited analysis provided by classical Venn diagrams. Users can select either UpSet tables or occurrence tables to visualize data.
2. Including phylogenetic analysis using an open-source tool called FastTree.
3. Analysis of gene family expansion and contraction.
Different species originate due to genetic events like contraction and expansion of gene families during evolution. During the process of evolution, adaptive contraction removes mutated gene copies, whereas expansion restores deleted or lost genes. Both of these events are essential to maintaining the size of gene families. OrthoVenn3, equipped with visualization tools, represents the size of a gene family in the form of a pie chart. The chart depicts contracted and expanded gene families, thus allowing a better insight into their evolutionary history.
4. Analysis of the colinearity function
Collinearity analysis allows the comparison and detection of changes in gene structure, the expansion of gene families, the existence of jumping genes, etc. OrthoVenn3 uses the MCScanX program to discover collinearity. It uses two models to display the collinearity based on size (the global scale and the in-species scale). OrthoVenn3 can perform colinearity analysis between species as well as orthologous clusters.
Conclusions and Future Implications
OrthoVenn has proven its efficiency in performing orthologous gene clusters and phylogenetic analyses on various species. The recent upgrade, OrthoVenn3, is equally effective and efficient in carrying out comparative analysis studies on orthologous clusters and provides a better visualization tool. It has a user-friendly interface that allows researchers to investigate evolution and genetic diversification. The research published in Nucleic Acids Research suggests using machine learning algorithms to examine orthologous clusters and the evolutionary history of species.
Article Source: Reference Paper | OrthoVenn3 is freely accessible at: https://orthovenn3.bioinfotoolkits.net
Learn More:


Sipra Das is a consulting scientific content writing intern at CBIRT who specializes in the field of Proteomics-related content writing. With a passion for scientific writing, she has accumulated 8 years of experience in this domain. She holds a Master's degree in Bioinformatics and has completed an internship at the esteemed NIMHANS in Bangalore. She brings a unique combination of scientific expertise and writing prowess to her work, delivering high-quality content that is both informative and engaging.


