
Qualitative data analysis, understanding patterns, finding possible targets/candidates, and intuitively displaying the results are among the crucially difficult aspects of next-generation sequencing experiments. These challenges are even more difficult for researchers who are not accustomed to writing computer code because the bulk of the analysis tools accessible demand programming knowledge.

Image Source: https://doi.org/10.1101/2022.11.25.517851
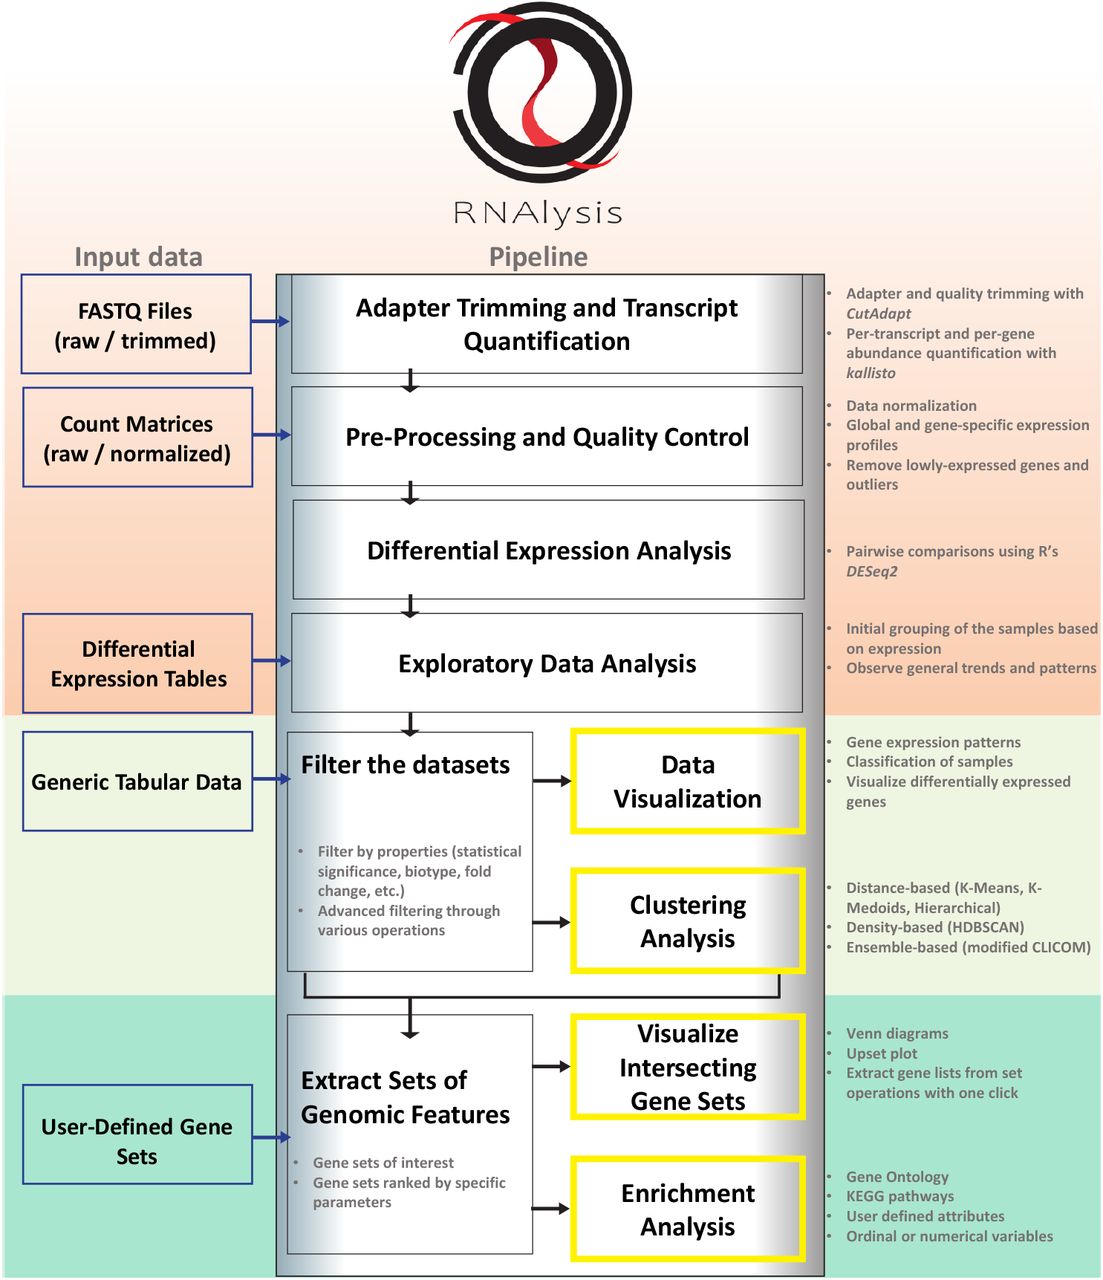
A customizable Python-based analysis program for RNA sequencing data is called RNAlysis. With the help of this tool, users may create unique analytic pipelines that address their unique research concerns, starting with raw FASTQ files and progressing through exploratory data analysis, data visualization, cluster analysis, and gene-set enrichment analysis. Researchers may conduct data analysis using RNAlysis’ user-friendly graphical user interface without writing any code. Assessing RNA data from many studies targeting C. elegans worms has shown the utility of RNAlysis. The application may be used to process data from any organism.
As a research tool for biologists, RNA sequencing tends to gain popularity. Researchers can compare the levels of gene expression in various biological specimens or experimental settings, group genes based on their patterns of expression, and characterize expression changes in genes involved in particular biological functions and pathways using a wide range of RNA-sequencing analysis techniques.
A unique analysis script must be written for any exceptional research topics because the majority of analysis tools can only handle a portion of these tasks. This script may be daunting to distribute or mimic.
Furthermore, many of the current tools can only be used by researchers with experience in computer programming since they need users to be knowledgeable about interpreting and composing code.
RNAlysis proposes a resolution for these concerns by
(1) using a modular strategy that enables users to either study their data gradually or build repeatable analysis pipelines out of specialized roles; and
(2) offering a graphical user interface (GUI) that is user-friendly and adaptable, enabling users to examine their data interactively and respond to a wide range of biological questions—regardless of how general or specialized—without writing a single line of code.
(3) providing in-depth documentation and step-by-step guided analyses to aid novice users in quickly picking up effective data analysis techniques.
Framework
RNAlysis was intended to accomplish three main objectives:
(1) pre-processing and data exploration;
(2) identifying relevant gene sets using filtering, clustering, and set operations;
(3) observing gene set intersections and applying enrichment analysis to those sets.
Using a graphical user interface, users may execute fundamental adapter trimming, RNA sequencing quantification, and differential expression analysis using RNAlysis in conjunction with tools like CutAdapt, kallisto, and DESeq2. In other words, users may start their RNAlysis analysis using sequencing data at any point in the process. Users can also import data tables created anywhere else into RNAlysis. Users of RNAlysis may study and evaluate many data tables simultaneously while flipping between them thanks to the program’s tabbed interface. RNAlysis may examine user-defined gene sets of interest, differential expression tables, and gene expression matrices (raw or normalized). Additionally, RNAlysis supports annotations on user-defined gene characteristics. Since RNAlysis uses tabular data, it may be used with any kind of data table.
Data verification and prepping
Initially, by consolidating and depicting the distribution and trends of the data, RNAlysis enables users to authenticate their findings. For instance, users may examine overall patterns in the data, assess the prevalence of gene expression between samples using scatter plots and pair plots, and look for any potential batch effects using clustergram plots and PCA projections.
Additionally, RNAlysis gives users the option to pre-process their data by normalizing it using one of the many methods (including Median of Ratios, Relative Log Ratio, Trimmed Mean of M-values, and more), filtering out genes with low levels of expression, and removing rows from their tables that have missing data.
Sorting and grouping data
Depending on the nature of their data and the biological questions they are trying to answer, users can further filter their data tables after pre-processing according to a wide range of factors. To best meet the demands of the user, these filtering functions might be used in a specified sequence or combination. Among many other things, these features include segmentation by statistical significance or the direction and magnitude of fold change, filtering genomic features by their type, and performing set operations between various data tables and gene sets (for example, intersections, differences, majority vote intersections, etc.) between tables.
The ability to quickly derive gene lists from set operations performed on the user’s tables and gene sets and utilize these lists in downstream applications is one of the strong aspects of RNAlysis.This can be accomplished by manually selecting subsets of interest using an interactive graphical platform or by using a pre-defined set operation (such as intersection or difference).
Finally, RNAlysis enables users to group genes depending on how frequently they are expressed. RNAlysis offers a wide range of clustering techniques, including ensemble-based clustering, density-based clustering, and distance-based clustering (K-Means, K-Medoids, Hierarchical clustering) (a modified version of the CLICOM algorithm). RNAlysis further offers customers a huge selection of distance measures for clustering research. Implementing distance metrics established specifically for biological applications, such as time-course gene expression data and distance metrics that were scientifically shown to be the most appropriate for transcriptomics research, are examples of this.
Implementing customizable pipelines and modularity
At any time throughout the analysis, filtered data tables may be stored or loaded. The names of the output files will automatically reflect the actions carried out on the data as well as their sequence. Additionally, RNAlysis displays the history of instructions performed on each table in the order they were applied, and any operation applied to the data may be undone with a single click.
Any of the tasks that RNAlysis provides may be “bundled” by users into different pipelines, as was previously indicated. These pipelines can then be applied in the same manner and with the same settings to any number of related data tables. When examining a large number of datasets aids users in saving time and avoiding errors and inconsistencies. Additionally, pipelines may be shared and exported with other researchers, who can utilize them on any machine that has RNAlysis installed. By facilitating the reporting and sharing of analytic pipelines, this feature improves the repeatability and impartiality of bioinformatics results.
Enrichment analysis
Users can do enrichment analysis for specific gene sets using the Enrichment window after using the aforementioned techniques to narrow down the data tables to gene sets of interest. A group of techniques known as “gene set enrichment analysis” can be used to find gene classes, biological processes, or pathways that are over- or underrepresented in a gene set of interest.
For enrichment analysis, RNAlysis offers a variety of strategies and statistical techniques, such as the traditional gene-set enrichment analysis, permutation tests, background-free enrichment analysis, and enrichment for ordinal or continuous variables. All significant model organism enrichment analysis annotations may be automatically retrieved by RNAlysis from well-known resources like KEGG pathways and Gene Ontology categories.
RNAlysis, however, also takes annotations for user-defined characteristics and groupings, in contrast to the majority of other analytic pipelines. This enables users to modify their analyses to meet their own requirements and biological inquiries.
Epilogue
All the features and functions that RNAlysis offers may be imported and utilized in common Python scripts, allowing users with coding skills to further automate and tailor their bioinformatic investigations. RNAlysis can be used entirely within a graphical interface. RNAlysis comes with a ton of documentation to help both new and seasoned users. Along with video demos, use samples, and suggested procedures, a user guide provides a birds-eye perspective of the modules and capabilities of RNAlysis.
Users can search for particular items to gain a more in-depth analysis of the theoretical foundation, use cases, and alternative parameters of the functions and capabilities offered in RNAlysis in the remaining documentation. The project has a public, open-source GitHub repository that is accessible. Additionally, the package has a large number of test cases that are automatically run each time the source code is changed to guarantee that data analysis using RNAlysis is consistent and trustworthy.
Article Source: Reference Paper | RNAlysis: GitHub
Learn More:
Top Bioinformatics Books ↗
Learn more to get deeper insights into the field of bioinformatics.
Top Free Online Bioinformatics Courses ↗
Freely available courses to learn each and every aspect of bioinformatics.
Latest Bioinformatics Breakthroughs ↗
Stay updated with the latest discoveries in the field of bioinformatics.

Riya Vishwakarma is a consulting content writing intern at CBIRT. Currently, she's pursuing a Master's in Biotechnology from Govt. VYT PG Autonomous College, Chhattisgarh. With a steep inclination towards research, she is techno-savvy with a sound interest in content writing and digital handling. She has dedicated three years as a writer and gained experience in literary writing as well as counting many such years ahead.


