
Many different tools are needed for the standard molecular dynamics (MD) analysis workflow, which frequently leads to a lack of coordination and interaction between the various analysis steps. VIAMD is an application that combines adaptable analysis components with a 3D visualization of molecular trajectories to address this problem. VIAMD (Visual Interactive Analysis of Molecular Dynamics) allows for the definition and evaluation of properties through its interactive scripting interface. The program provides context-aware expression feedback and suggestions through data and visualizations. This makes it possible to statistically analyze distributions, correlate with spatial conformations, and effectively aggregate multidimensional features like spatial distribution functions. The study conducted by Linköping University, Sweden, presents VIAMD, a promising technique that has the potential to improve MD visualization and analysis and to further research in several scientific fields.
Understanding Molecular Dynamics
The process of examining characteristics from simulated molecular systems can be defined as molecular dynamics (MD) analysis. Periodically, base properties, like energy and coordinates, are sampled and written as output during the simulation. Then, to derive new features, these base properties are either directly or indirectly investigated. The properties investigated naturally vary since molecular dynamics (MD) is utilized in many scientific fields to analyze events at the molecular level. The emergence of MD analysis tools, which enable researchers to create new properties from the basis set by utilizing expressions and operations through a scripting interface, might be attributed to this property variation.
The standard MD process involves an iterative process of visualizing systems to gain a comprehensive spatial understanding of their structures and temporal aspects.
Next, using a programming tool, properties are defined and computed; their values are plotted and examined. The spatial and temporal geometric configurations shown in the visualization tool can then be connected with the plotted results, providing additional hypotheses to test. The majority of molecular visualization tools provide analysis in one way or another, however, they are frequently task-specific and installed as distinct plugins. Task-specific refers to the fact that its data are not accessible to other program components but are intended to compute and visualize a particular attribute.
Molecular visualization tools allow users to configure visual representations, including Chimera, VMD, Pymol, Caver, Jmol/Jsmol, Samson, Ovito, MegaMol, and Mol*. The primary goal of these tools is to generate images for scientific papers. A good number of the tools on the list also have features for analysis. Kozlikova et al. and Kut’aḱ et al. offer a thorough summary of the molecular visualization methods employed in the tools mentioned above.
Exploring VIAMD – Visual Interactive Analysis of Molecular Dynamics
VIAMD, a software developed from an initial prototype, has evolved and been redesigned to suit a broader setting, demonstrating its evolution and adaptability. By closely tying together the three primary analytical tools—property computation, property plotting, and molecular visualization—it is intended to optimize the workflow that is typical in MD study. Utilizing emergent synergies created by tight connections, we can place the tools in the same application.
Some examples of these synergies are the plots’ click-and-inspect capabilities, which allow correlations between structure conformation and value. Another example is offering recommendations for properties based on the user’s current selections and assisting the user with declaring properties by directly displaying the structures and operations required.
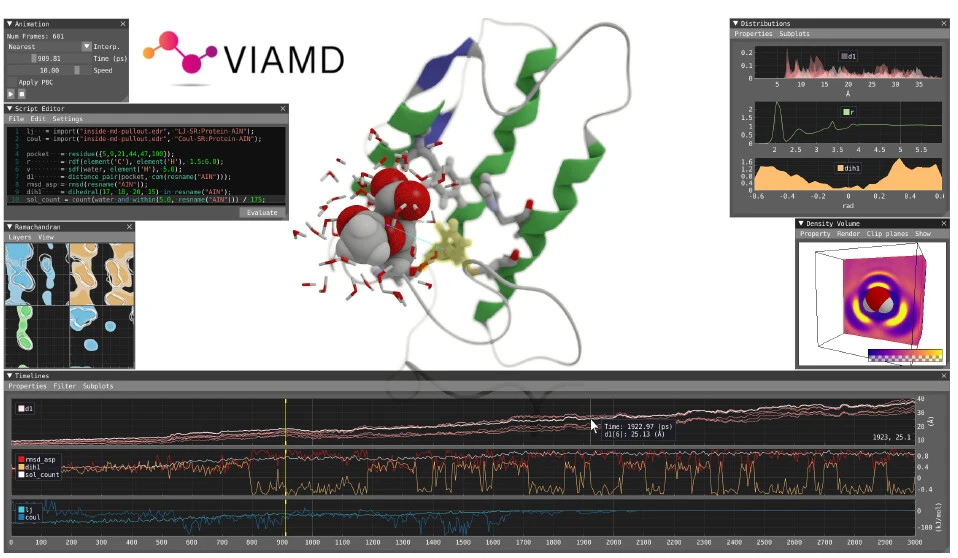
The focal point of the application is the spatial view, a three-dimensional representation of the molecular data set. A number of components are presented in connection with the spatial view, most of which are analysis-focused. The script editor, which is the main tool used to coordinate the analysis, allows the user to create expressions and assign them to different properties. Next, like Colvars (collective variables), the screenplay is assessed across the trajectory frames.
After being evaluated, the user-defined attributes can be examined in each of the application’s parts, becoming the application’s core analysis entities.
The components of VIAMD are spatial view, representation window, animation window, script editor, Ramachandran plot, temporal window, density volume window, distribution window, and shape space window.
An OpenGL 3.30-compatible graphics accelerator and a dual-core processor with 4 GB of RAM are the minimal specifications required for the proper installation and working of the application. Since the performance of the evaluation decreases with the number of threads available, it is advised to have a multicore machine (4+) and at least 8 GB of available memory.
Workspace Management
The workspace files that have the default file extension of .via can be used to save and load the state of the program. It includes general settings, stored selections, the script, representations, and the condition of the camera at that moment. Every text editor can be used to alter the text-based ASCII format. Stored selections are the only exception; they are compressed and kept in Base64.
Scalability through Parallelism
The program is made to take advantage of thread-level parallelism through the submission of computation-intensive tasks to an internal task pool. Script evaluations, Ramachandran distributions, and shape-space distributions are a few examples of such jobs.
Processing a variety of elements (i.e., trajectory frames) may be required for each activity. The range is divided into subranges that are processed concurrently in certain situations. The CMake script exposes the number of worker threads in the thread pool as a user-configurable compile-time parameter. This guarantees the task system’s ability to adjust to the quantity of hardware threads at its disposal. It should be noted that one thread is set aside as the primary thread for the program at all times, managing logic and rendering to preserve interactivity.
Dynamic Cache System
This application uses a dynamic cache mechanism that streams in and decompresses trajectory frames as needed. The CMake script contains a user-configurable compile-time parameter that regulates the cache system’s memory capacity. This method enhances memory usage and ensures efficient handling of extensive trajectory data.
Conclusions
VIAMD is a comprehensive application that was created to streamline the MD analysis workflow by integrating charting, property computation, and visualization into a single, integrated tool. The ability to explicitly declare derived properties from geographical selections, interactivity, and property visualization to support user assertion of the involved operations and structures are only a few advantages of this optimization of the standard MD-analysis procedure.
Article Source: Reference Paper | VIAMD Source Code: GitHub
Learn More:


Deotima is a consulting scientific content writing intern at CBIRT. Currently she's pursuing Master's in Bioinformatics at Maulana Abul Kalam Azad University of Technology. As an emerging scientific writer, she is eager to apply her expertise in making intricate scientific concepts comprehensible to individuals from diverse backgrounds. Deotima harbors a particular passion for Structural Bioinformatics and Molecular Dynamics.


