
Scientists from UPenn have developed a suite of tools and algorithms for analyzing heterogeneous and large RNAseq datasets for detecting, quantifying, and visualizing the splicing variations therein. The suite of algorithms and tools is present as a part of the package MAJIQ version 2. The former MAJIQ (Modeling Alternative Junction Inclusion Quantification) package was developed to define and quantify mRNA splicing in terms of local splicing variations (LSVs) as units. The original version of MAJIQ was capable of comparing small RNAseq datasets obtained from biological replicates. The ubiquitous applications of RNAseq data analysis pose the challenge of handling large and heterogeneous datasets. MAJIQ v2 is capable of handling datasets comprising thousands of samples obtained under several experimental conditions with increased transcriptomic complexity and variability.
The significance of Alternative Splicing and why do we care?
The central dogma of molecular biology states that DNA makes RNA, which makes proteins. In other words, genes, which are segments of DNA, contain coded instructions for making different kinds of molecules. Genes make RNA through the process of transcription. Before undergoing the process of translation that results in proteins, the transcribed RNAs undergo a process by which different segments of the RNA are either removed or retained. This is alternative splicing and has been observed to occur in more than 90% of human genes.
The process of alternative splicing introduces variations in terms of the gene products from one single gene, which then results in gene products with different functions. Alternative splicing introduces variation in gene products across cells, tissues, and individuals. Some of these variations can be deleterious, causing diseases. The production of different gene isoforms resulting from alternative splicing can lead to changes in translated protein domains, changes in degradation rates, as well as localization. Studies have shown that most human genes are alternatively spliced, and about a third of them are shown to change their major isoforms across 16 human tissues. Splicing defects are also known to be involved in monogenic as well as complex diseases. Thus, large RNAseq datasets are generated to study the variations in splicing events across diverse experimental conditions. However, such datasets are typically heterogeneous and replete with splicing variability. Confounding factors giving rise to such variability may be corrected using methods such as Moccasin, however, fully removing variability is unlikely and can rather lead to the loss of a true biological signal. Thus the need for developing methods for accurately detecting, quantifying, and visualizing splicing variations in large and heterogeneous datasets.
Local Splicing Variations (LSVs) and splice graphs
Transcriptome variations are studied under two paradigm settings, viz., at the level of full gene isoforms or by quantifying localized alternative splicing events within a gene. Quantifying methods for whole gene isoforms are met with several limitations, such as the high cost of long-read technology for obtaining all isoforms and the sparsity of reads, and positional bias in the case of short-read technology. Thus, researchers focus more on analyzing localized alternative splicing (AS) events.
Alternative splicing events are typically analyzed using splice graphs. As introduced by Heber et al. in 2002, a splice graph is a directed graph where the nodes represent transcribed positions, and each edge connects pre-mRNA spliced together in different transcripts. Local splice variations (LSVs) are easily visualized as splits (multiple edges) in a splice graph, where several edges either come into or from a single exon, the reference exon.
The following figure illustrates the concept of a splice graph.
Image source: https://doi.org/10.7554/eLife.11752
MAJIQ framework overview
The original MAJIQ framework formulated transcriptome variations in units of local splicing variations using splice graphs. This LSV-based approach incorporates algorithmic design for detecting, quantifying, and visualizing LSVs. The framework comprises two major components of MAJIQ Builder and MAJIQ Quantifier.
The builder analyzes a given set of RNAseq experiments and a transcriptome database to detect LSVs, both known and de novo. The quantifier is then applied to estimate PSI (the marginal percent selected index for each junction involved in the LSV) or dPSI (changes in PSI) for the detected LSVs. The quantifier implements a Bayesian framework for the estimation of the PSI posterior distribution.
The visualization module is VOILA, which was also included as part of the original MAJIQ package.
The following figure illustrates the MAJIQ framework.
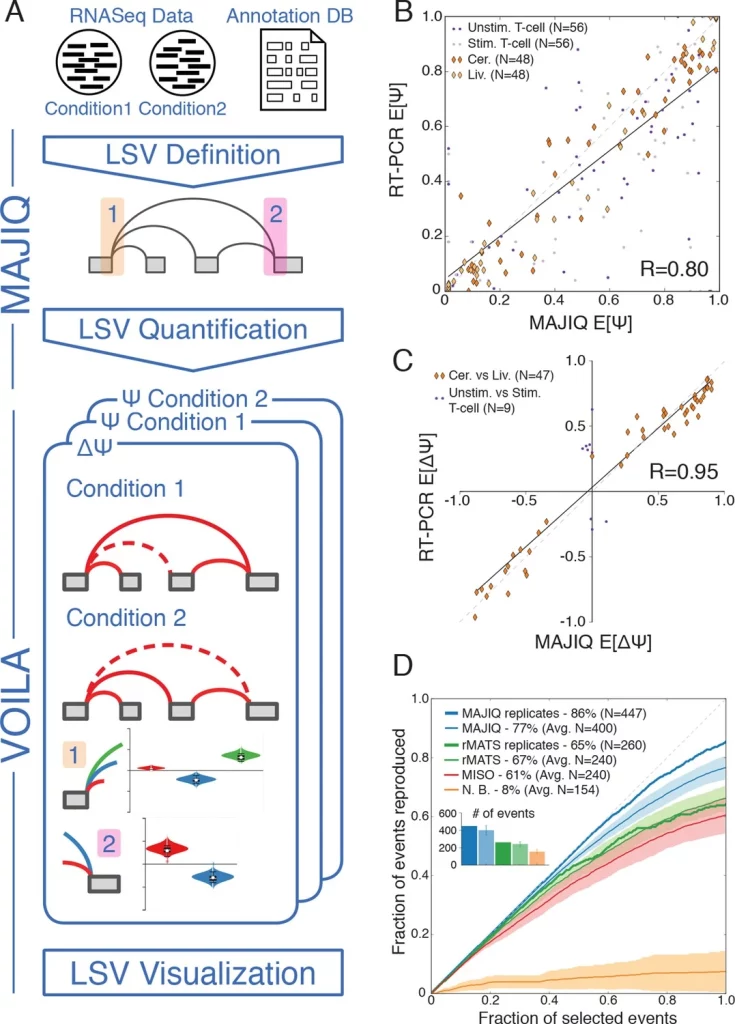
Image source: https://doi.org/10.7554/eLife.11752
MAJIQ v2: The upgraded version
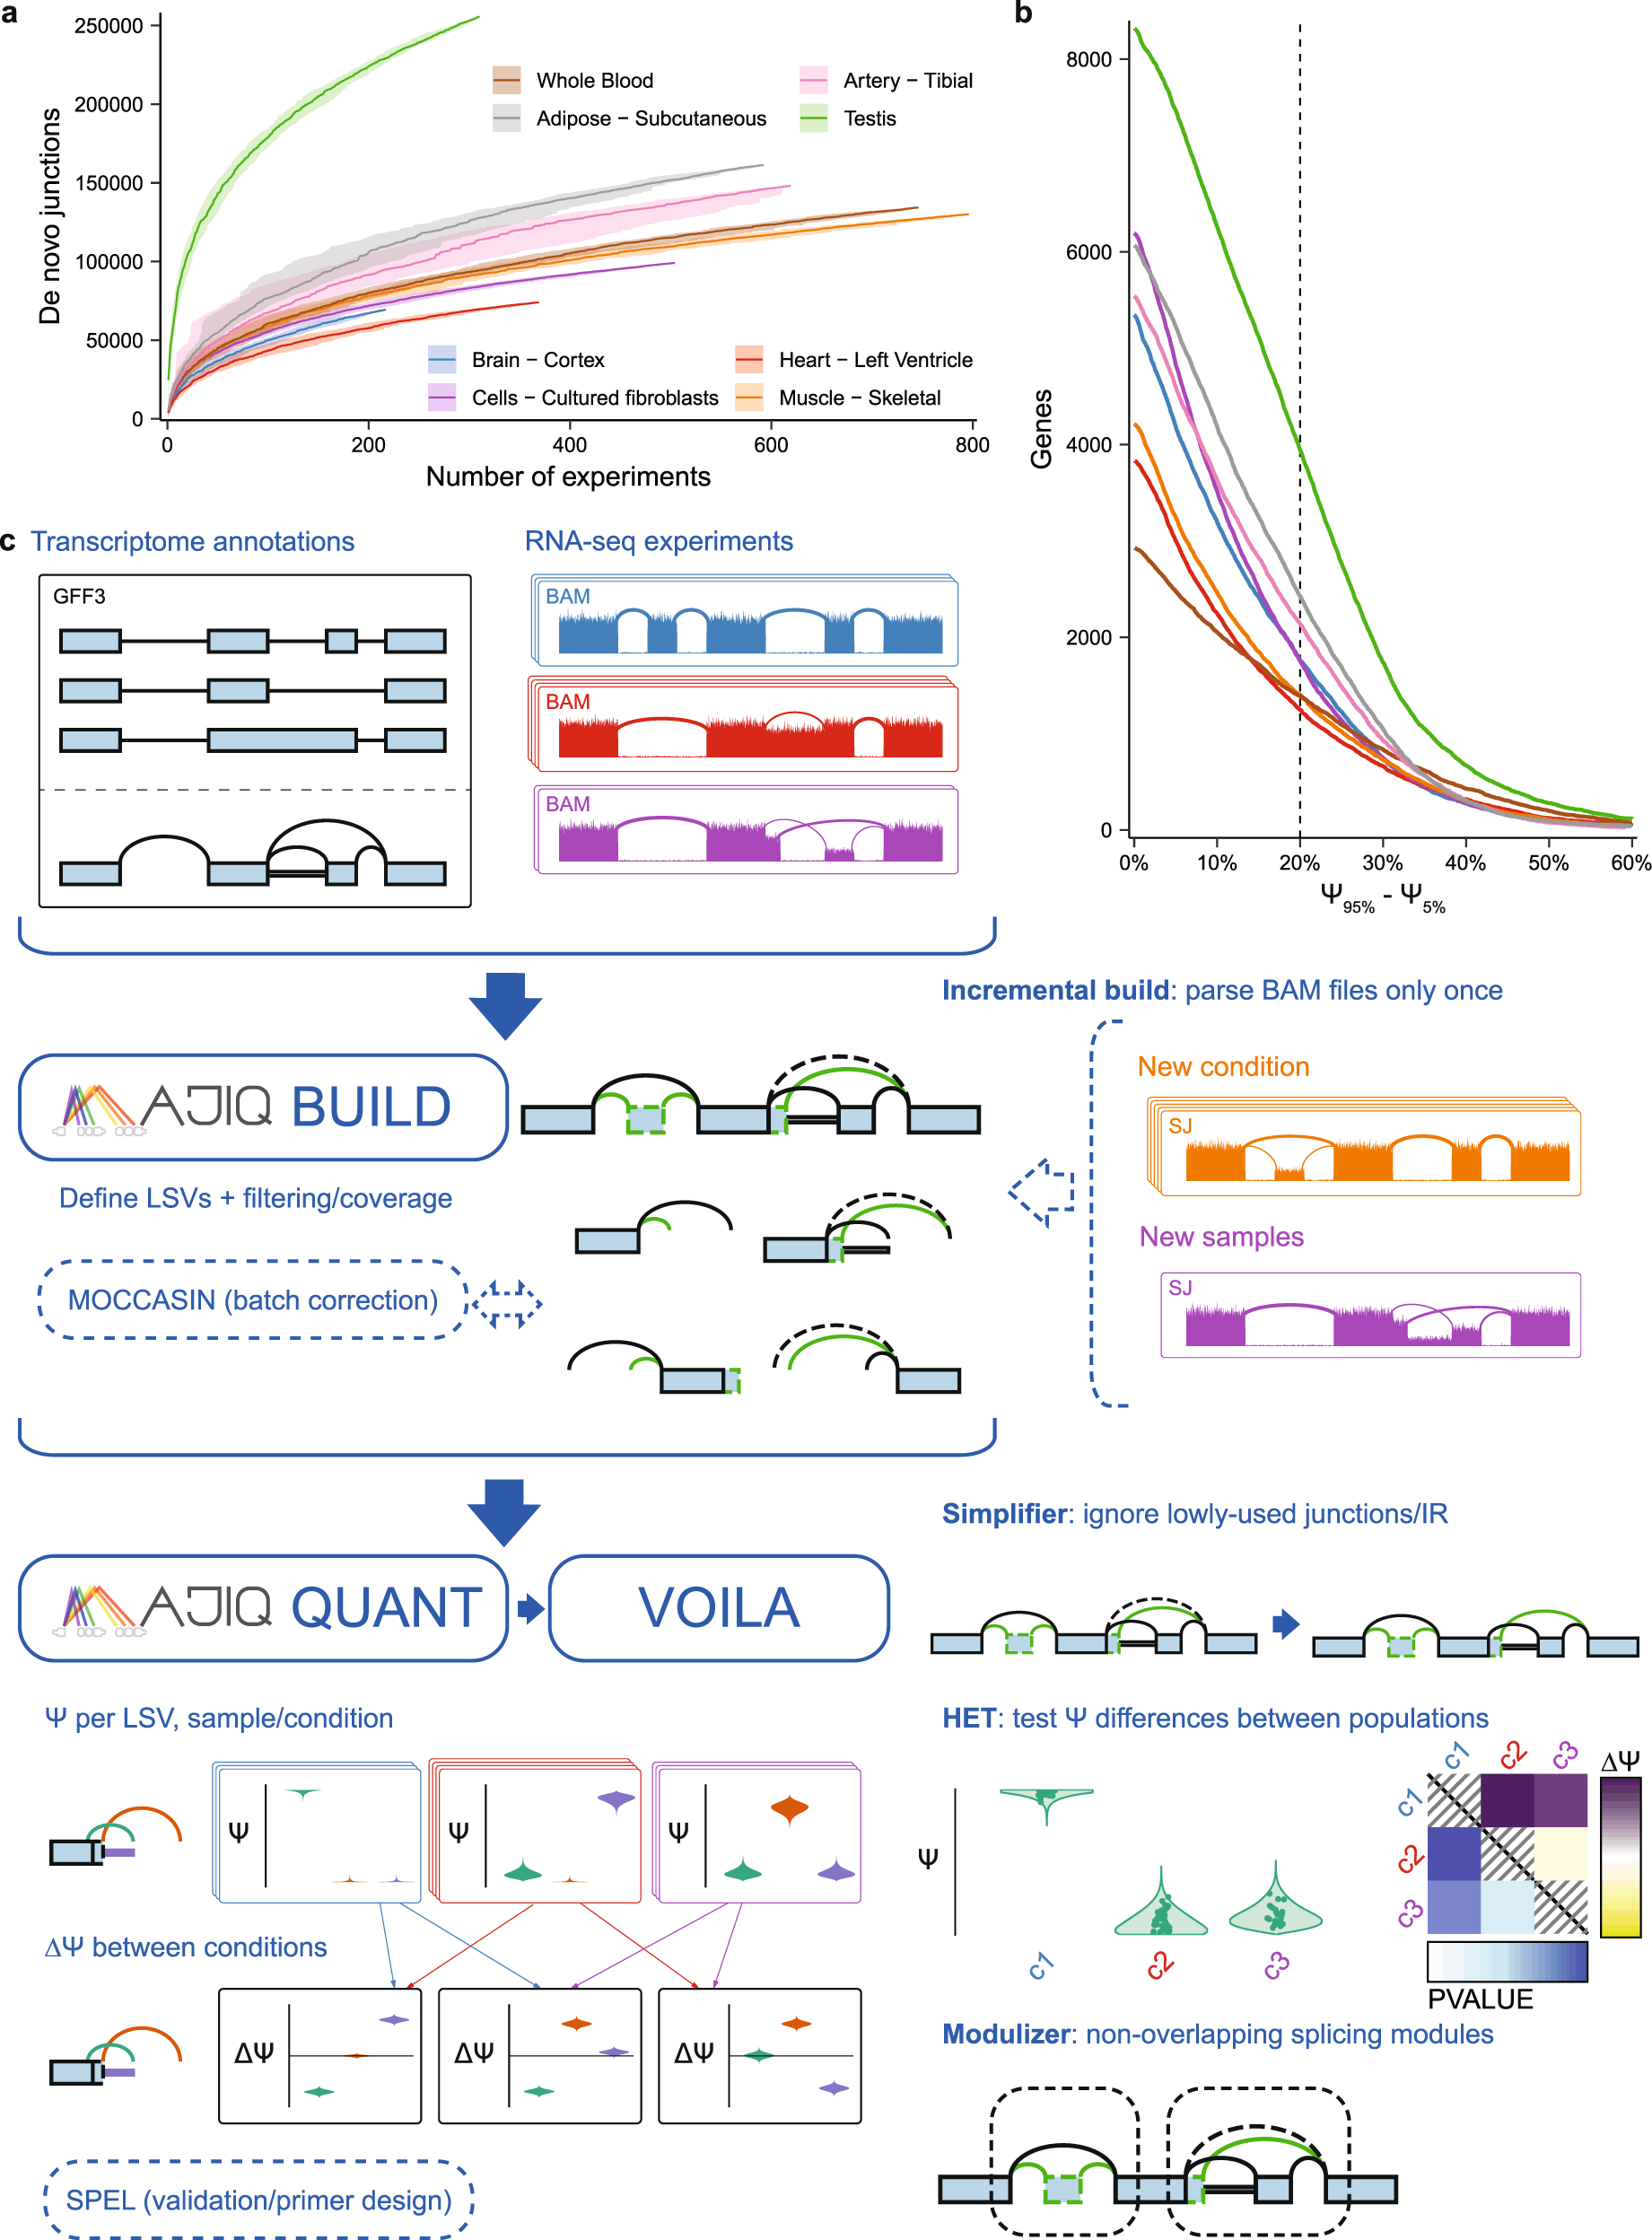
In the current article, the authors describe the upgraded version, MAJIQ v2, for LSV analysis in large and heterogeneous datasets. The authors incorporated a suite of novel tools and algorithms to address large and heterogeneous datasets. These tools are designed to include non-parametric statistical tests for differential splicing (MAJIQ HET), an incremental splice graph builder, a novel algorithm for quantifying intron retention, a method to detect high-confidence negative (non-changing) splicing events, and a de novo Modulizer algorithm to parse all LSVs across genes into modules, which are then classified into subtypes.
The new version also incorporates an upgraded version of the visualizer, VOILA v2, which is now capable of comparing multiple sample groups, simplifying splice graphs, and allowing the user to probe individual data points while handling thousands of samples.
The following figure illustrates the new VOILA v2.
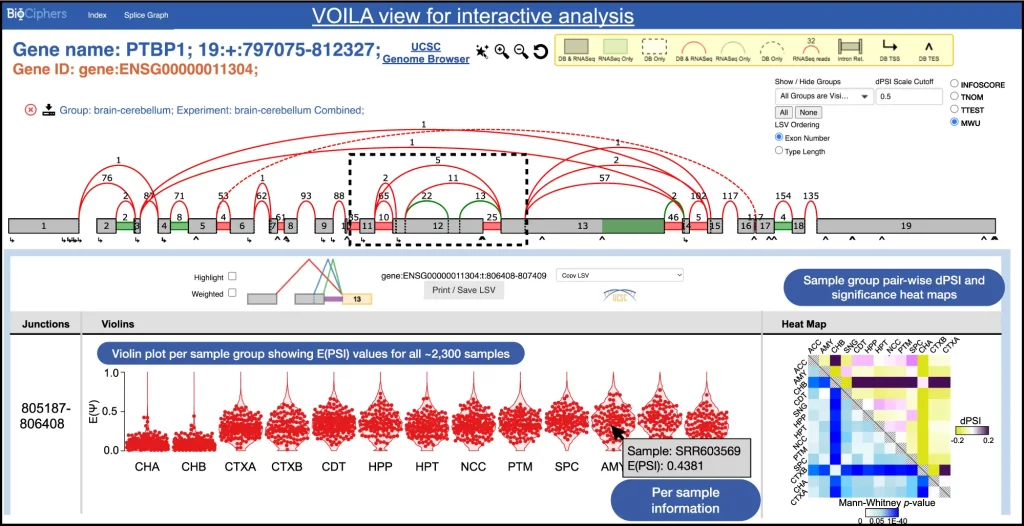
Image source: https://doi.org/10.1038/s41467-023-36585-y
Conclusion
The new version of the MAJIQ framework, MAJIQ v2, has been developed to incorporate capabilities of analyzing LSVs for large and heterogeneous datasets. The authors have included a suite of new tools and novel algorithms for the detection, quantification, as well as enhanced visualization of transcriptome variations. The methods have shown high performance, and the authors have applied MAJIQ v2 to 13 brain subregions from 2335 samples for analyzing differential splicing. Overall, this is indeed a remarkable upgrade to the toolkit for analyzing RNAseq datasets.
Article Source: Reference Paper | MAJIQ Original Version Paper
Learn More:


Banhita is a consulting scientific writing intern at CBIRT. She's a mathematician turned bioinformatician. She has gained valuable experience in this field of bioinformatics while working at esteemed institutions like KTH, Sweden, and NCBS, Bangalore. Banhita holds a Master's degree in Mathematics from the prestigious IIT Madras, as well as the University of Western Ontario in Canada. She's is deeply passionate about scientific writing, making her an invaluable asset to any research team.


