
Advancements in fluorescence microscopy-based imaging techniques have made it possible for researchers to view and analyze mitochondrial networks in 4D. Researchers at UCSD have released a new software called MitoTNT that utilizes fluorescence microscopy data to track mitochondrial time-varying networks. The efficiency of mitochondrial network tracking depends on the quality of the image generated by fluorescence microscopy.
Mitochondrial Network
Mitochondria form tubular networks that are important in maintaining basic mitochondrial functions like fusion, division, mobility, and adhesion. As opposed to the popular belief of its kidney bean structure, mitochondria contain interconnected tubules and fill up three dimensions in space. On top of that, the mitochondrial network in the fourth dimension of time is in a constant state of motion via fusion, fission, and transport (active and passive). The four dimensions that make up a mitochondrial network are fission, fusion, motility, and the time constant. Disruption in the mitochondrial network can cause diseases like obesity, diabetes, cardiovascular diseases, cancer, etc.
Lattice Light-sheet Microscopy
The limited knowledge of mitochondrial time-varying networks is attributed to the unavailability of tools and techniques to analyze the mitochondrial network. Traditional microscopic techniques like fluorescence microscopy fail to capture the full range of the network’s 4D dynamics. Moreover, living tissues cannot be viewed under an electron microscope. Development in the field of fluorescence Microscopic techniques like lattice light-sheet microscopy has helped analyze mitochondrial temporal networks. Lattice light-sheet microscopy casts thin sheets of light upon the cell illumination, one tissue slice at a time. This reduces the amount of light exposure on live cells and causes low phototoxicity. Lattice light-sheet microscopy allows researchers to capture the four dimensions of the inside of a mitochondrion in multiple colors over a long period of time and generate large amounts of data.
The absence of suitable methods to analyze datasets generated from mitochondrial networks analysis in live cells led Researchers at The Johannes Schöneberg lab, UCSD, to develop a Python programming-based computational approach called MitoTNT. It can help visualize, track, and analyze the 4D mitochondrial network data.
Need for MitoTNT (Mitochondrial Temporal Network Tracking)
MitoTNT is one of a kind computational approach for tracking the Mitochondrial Temporal Network in 4D. MitoTNT is written in Python using a JupyterLab interface. It is developed on an existing open-source image analysis platform, MitoGraph. The image visualization engine of MitoTNT is provided by ChimeraX, a next‐generation visualization software developed by UCSF. MitoTNT efficiently builds a temporal network by using the available topological and spatial information of the mitochondrial network.
The existing quantitative analysis software like MitoSPT, QuoVadoPro, and MyToe was created to analyze two-dimensional fluorescence microscopy-based images of mitochondria. MitoGraph is a 3D fluorescence microscopy-based image analysis tool that cannot track the change in network topology over the time axis. 4D analysis software like Mitometer and TrackMate cannot track fragment-level information.
Working Principle and Application of MitoTNT
Working of MitoTNT involves the following three steps: 1) Identification of movement patterns of mitochondrial sub-fragments and new network branches. 2) Followed by the identification of events like fission and fusion, and 3) Creating simulations based on movement patterns of the mitochondrial network.
MitoTNT is primarily used for the analysis of the mobility of the mitochondrial network. Secondly, it can be used to identify and analyze mitochondrial fission and fusion events. Lastly, it can be used to analyze the mitochondrial temporal network. In-silico and in-vitro-based validation shows the efficiency of MitoTNT in tracking high-resolution mitochondrial networks with detailed measurements of mitochondrial motility, fusion, and fission.
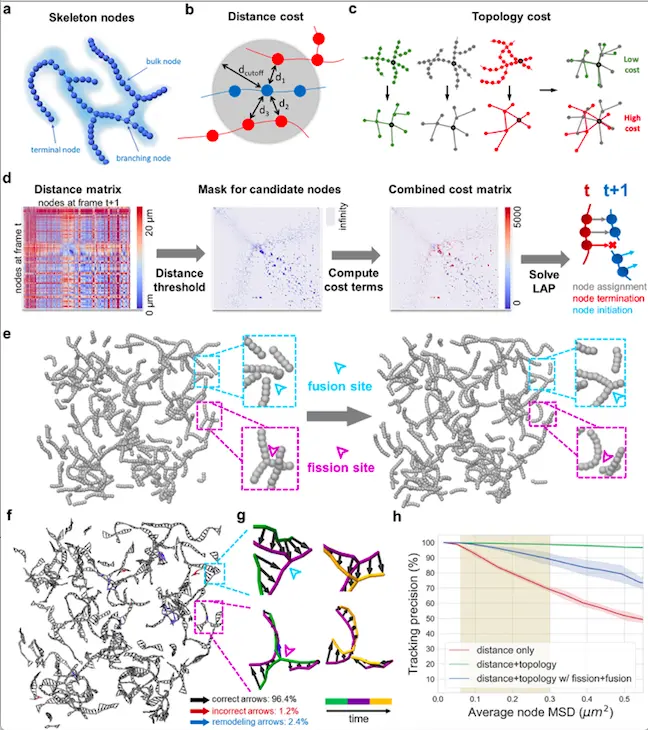
The researchers at UCSD used human-induced pluripotent stem cells to generate high-resolution 4D mitochondrial network data using Lattice light-sheet microscopy. The mitochondrial networks graph is represented as either terminal nodes or branching nodes. For better coverage of the network, bulk nodes were also included that are placed at equal distances along the skeletal frame. The researchers named all three nodes as skeleton nodes and used them as units of tracking the mitochondrial network. MitoTNT is capable of arranging Lattice light-sheet microscopy data into skeleton nodes.
The article published in PLOS Computational Biology highlights network Topology and Spatial proximity as unique traits that help in network tracking. The distance between two successive frames is measured as Spatial proximity. The researchers achieved network tracking using a Linear assignment problem (LAP) based evaluation by performing the following steps:
- A pairwise distance matrix was used to calculate the distance between nodes in two successive frames.
- For each node, local distance thresholds were estimated, and only nodes present within the threshold were considered.
- A topological dissimilarity score was assigned to each node pair.
- The problem arising due to variation in the number of skeleton nodes is solved either by linking two nodes between frames or terminating a node in the present frame, or forming a new node at the next frame.
- To connect precipitously terminated nodes, Gap closing was performed at the end of the frame.
Validation of Result
The accuracy of network tracking data generated by the MitoTNT algorithm was tested against topology and distance constraints. Though most of the tracking events were correctly represented, some inconsistency in data was also found where distance-based constraint was used. It was probably due to the compact and dense nature of the network. It was also observed that mitochondrial movement might differ in speed and direction. The experiment also highlighted the fact that fragments of the mitochondrial network could be tracked by tracking nodes, and mitochondrial structures like microtubules may be involved in the processes of fusion and fission.
Conclusion
Mitochondria are membrane-bound organelles surrounded by a phospholipid bilayer. It provides up to 90% of the energy needed by cells in the form of ATP. Based on the energy requirements, the number of mitochondria per cell varies. The muscle, Brain, kidney, and liver are some high energy-consuming organs with a large number of mitochondria. Reduced energy production in these organs often leads to diseases. Mitochondria undergo constant fusion and division, leading to the formation of tubular networks that are in a constant state of motion. Thus, mitochondrial networks can either exist as separate structures or as interconnected tubular networks. MitoTNT is a reliable and adept alignment-based algorithm to track time-varying movement in mitochondria. It can also track fission, fusion, and intra-network movement patterns. Further research in the field of tracking mitochondrial networks can explore its role in various cellular activities like early detection, manifestation, and progression of diseases like cancer.
Article Source: Reference Paper | MitoTNT: Website | Data Availability: GitHub Link
Learn More:


Sipra Das is a consulting scientific content writing intern at CBIRT who specializes in the field of Proteomics-related content writing. With a passion for scientific writing, she has accumulated 8 years of experience in this domain. She holds a Master's degree in Bioinformatics and has completed an internship at the esteemed NIMHANS in Bangalore. She brings a unique combination of scientific expertise and writing prowess to her work, delivering high-quality content that is both informative and engaging.


