

In order to perform an extensive benchmarking of the known tools for differential abundance analysis, the researchers from the University of Padova used a simulator of microbiome data to create a simulation framework based on microbiome data. This is the first step towards the development of a robust, reliable, and fair simulation framework that will allow analysts to make informed choices about which analysis tools to use.
In recent years, high-throughput DNA sequencing techniques have become increasingly efficient and cost-effective, allowing researchers to study complex microbial systems better. A great deal of interest has been seen recently in studying the microorganisms that are characteristic of different ecological niches. By comparing two classes of subjects or samples, a different abundance analysis can be used to find differences between the abundance of each taxon. As a result of the challenges of microbiome data, several bioinformatic methods have been developed. These methods take into account the sparsity of microbiome data, the differences in sequencing depth between samples, and the compositionality of the microbiome.
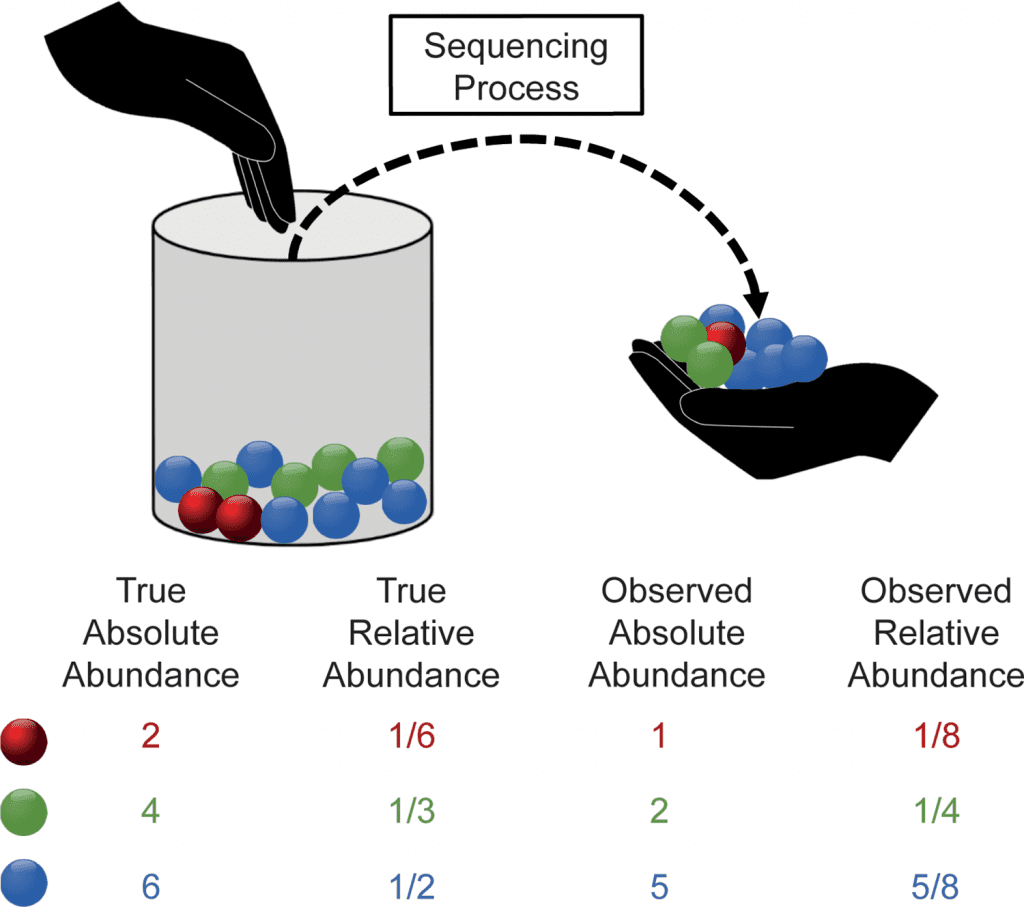
Image Source: https://doi.org/10.1371/journal.pcbi.1010467
Many different fields, from health to the environment, have benefited from differential abundance analysis. Since there is no known biological truth, it is difficult to validate the results obtained. A microbial sequencing count data simulator, metaSPARSim, is used in this study to simulate experimental data with differential abundances. With great attention to both the reliability of the simulated scenarios as well as the evaluation metrics, recently developed, compared and established methods on a common benchmark. In the performance overview, several scenarios were examined. These included the effect of covariates such as sample size, differentially abundant features percentage, sequencing depth, feature variability, normalization approach, and ecological niches on methods’ results. It appears that methods control type I error well at high sample sizes, as well as false discovery rate, whereas recall appears to depend on the dataset and sample size.
As a result of Next-Generation Sequencing (NGS), microbial populations have been studied more closely in many diseases, with a focus on differential abundance (DA) analysis, which has the potential to identify specific taxa responsible for phenotypic differences among samples. However, as noted recently by Wallen et al., results depend heavily on the applied DA method, particularly for large Parkinson’s disease gut 16S datasets. Furthermore, the preprocessing of microbiome sequencing count data strongly influences results, and appropriate data treatment is essential to avoid misinterpretation in subsequent statistical analyses because, as several authors have pointed out, NGS data has characteristics that cannot be ignored and that make analyzing them challenging. It is evident from the count tables that there are a high number of null values, i.e., they are highly sparse. It also takes into account the depth of the sample sequencing rather than the total number of taxa in the sample: abundances are relative to that depth. Simplex is a sub-space that conveys relative information, is compositional, and is a sub-space that conveys relative information. Lastly, different samples have different sequencing depths.
Using a sample size and a percentage of DA features, a reliable simulation framework generates microbiome datasets under two experimental conditions. A table of abundances based on underlying DA taxa allows for an in-depth evaluation of the primary methods used in this field. In particular, the authors have exploited a simulation framework based on the gamma-MHG model introduced by metaSPARSim, which has been proven to be very useful in reconstructing the compositional nature of 16S data.
Using this model, one can investigate how parameters affect performance, and no tools involved in the assessment assume this model (potential bias avoided). The literature has recently proposed MB-GAN and SPARDOSSA2 as additional simulation tools. A generative adversarial network (GAN) from deep learning is exploited in the first approach to simulate DA features, for which it is unclear how the parameters should be set.
In contrast, SPARDOSSA2 proposes a hierarchical model that takes into account the interaction structure between taxa and the environment. The latter feature may be of general interest, but it should not directly impact univariate DA approaches when considering correlation structures between taxa during simulation. SPARDOSSA2 was tested only on shotgun data, which, although sharing some characteristics with 16S count data, have some differences in terms of taxonomic resolution, which could affect the distribution of data. It is concluded that 16S datasets are best fitted by a negative binomial distribution, while shotgun data are best fitted by a zero-inflated negative binomial distribution. Kurtz et al. proposed a Normal-to-Anything (NorTA) model for simulating count tables, and Prost et al. proposed a zero-inflated multivariate Gaussian copula model. The ability of these approaches to reproduce 16s data distribution has not been extensively tested and has been proposed in the field of network reconstruction methods.
As a result of observing how the performance changes according to the simulation scenarios, important conclusions can be drawn. When sample sizes are particularly small, such as SS = 10, many methods fail to detect DA features, resulting in an undefined FDR and no recall. As part of the study design process, this aspect would be considered. It is likely that a different distribution of mean absolute abundances will negatively affect recall performance. Furthermore, it was found that features with less variability were more likely to be remembered. In addition to affecting the performance of the methods, the intensity variety relationship could also have an impact on it. Thus, considering this aspect is important when conducting benchmark studies and developing new DA analysis tools.
According to the study, bioinformatic tools for differential abundance analysis need further improvement. In light of the continuous development of new technologies and analysis methods, it is believed that this work has strengthened the foundation for future comparative studies. Taking into account the mean and variance of the true absolute abundance, the proposed simulation framework can be extended to other parametric models. Moreover, this research aims to aid the scientific community in improving the reliability and quality of various 16S rDNA-Seq count tools by developing and using a common evaluation framework.
Learn More:
Top Bioinformatics Books ↗
Learn more to get deeper insights into the field of bioinformatics.
Top Free Online Bioinformatics Courses ↗
Freely available courses to learn each and every aspect of bioinformatics.
Latest Bioinformatics Breakthroughs ↗
Stay updated with the latest discoveries in the field of bioinformatics.
Srishti Sharma is a consulting Scientific Content Writing Intern at CBIRT. She's currently pursuing M. Tech in Biotechnology from Jaypee Institute of Information Technology. Aspiring researcher, passionate and curious about exploring new scientific methods and scientific writing.


