
PCA (Principle Component Analysis) is a commonly used technique in biomedical research to identify similarities and differences between groups of samples. Though conventional PCA is a great tool, it still has some limitations in visualizing and quantifying batch effects; therefore, to overcome these limitations, researchers from the Department of Bioinformatics and Computational Biology, The University of Texas MD Anderson Cancer Center, Houston, TX, USA developed PCA-Plus. It is an enhanced version of conventional PCA with advanced and additional features for improved diagnosis, detection, and quantification of differences in a group of samples. It appears to be a useful and valuable tool for researchers working on large datasets, particularly in the field of bioinformatics and related areas, where batch effects and group differences are important considerations.
To untangle the complexities of datasets with many variables, PCA (Principal Component Analysis) is an important tool to help researchers in data analysis. PCA is a powerful statistical technique that sorts data into a simpler and much more understandable form. It identifies the main components that explain the most variance in the given dataset. PCA reduces the complexity of your data while preserving the essential information by focusing on the main components. This makes it easier to visualize trends and patterns, dimensionality reduction, feature extraction, and anomaly detection. It has been used in a wide variety of contexts, for example, image processing and compression, characterization of molecular dynamics, linguistic information retrieval, and assessment of batch effects.
Researchers from The University of Texas MD Anderson Cancer Center used conventional PCA as a tool for critical quality control of batch and trend effects in multi-omic profiling data produced by The Cancer Genome Atlas (TCGA) project of the NCI. They found out that conventional PCA visualizations were often hard to interpret when inter-batch differences were moderate in comparison with intra-batch differences; it was also difficult to quantify batch effects objectively.
Limitations of conventional PCA
- With a large number of samples or groups, its plot can fail to distinguish overlapping but distinct groups of sample points.
- It has no mechanism to portray trends.
- Its already annotated pre-existing groups make it hard to discover new, influential technical or biological batch variables.
- It is sensitive to outliers.
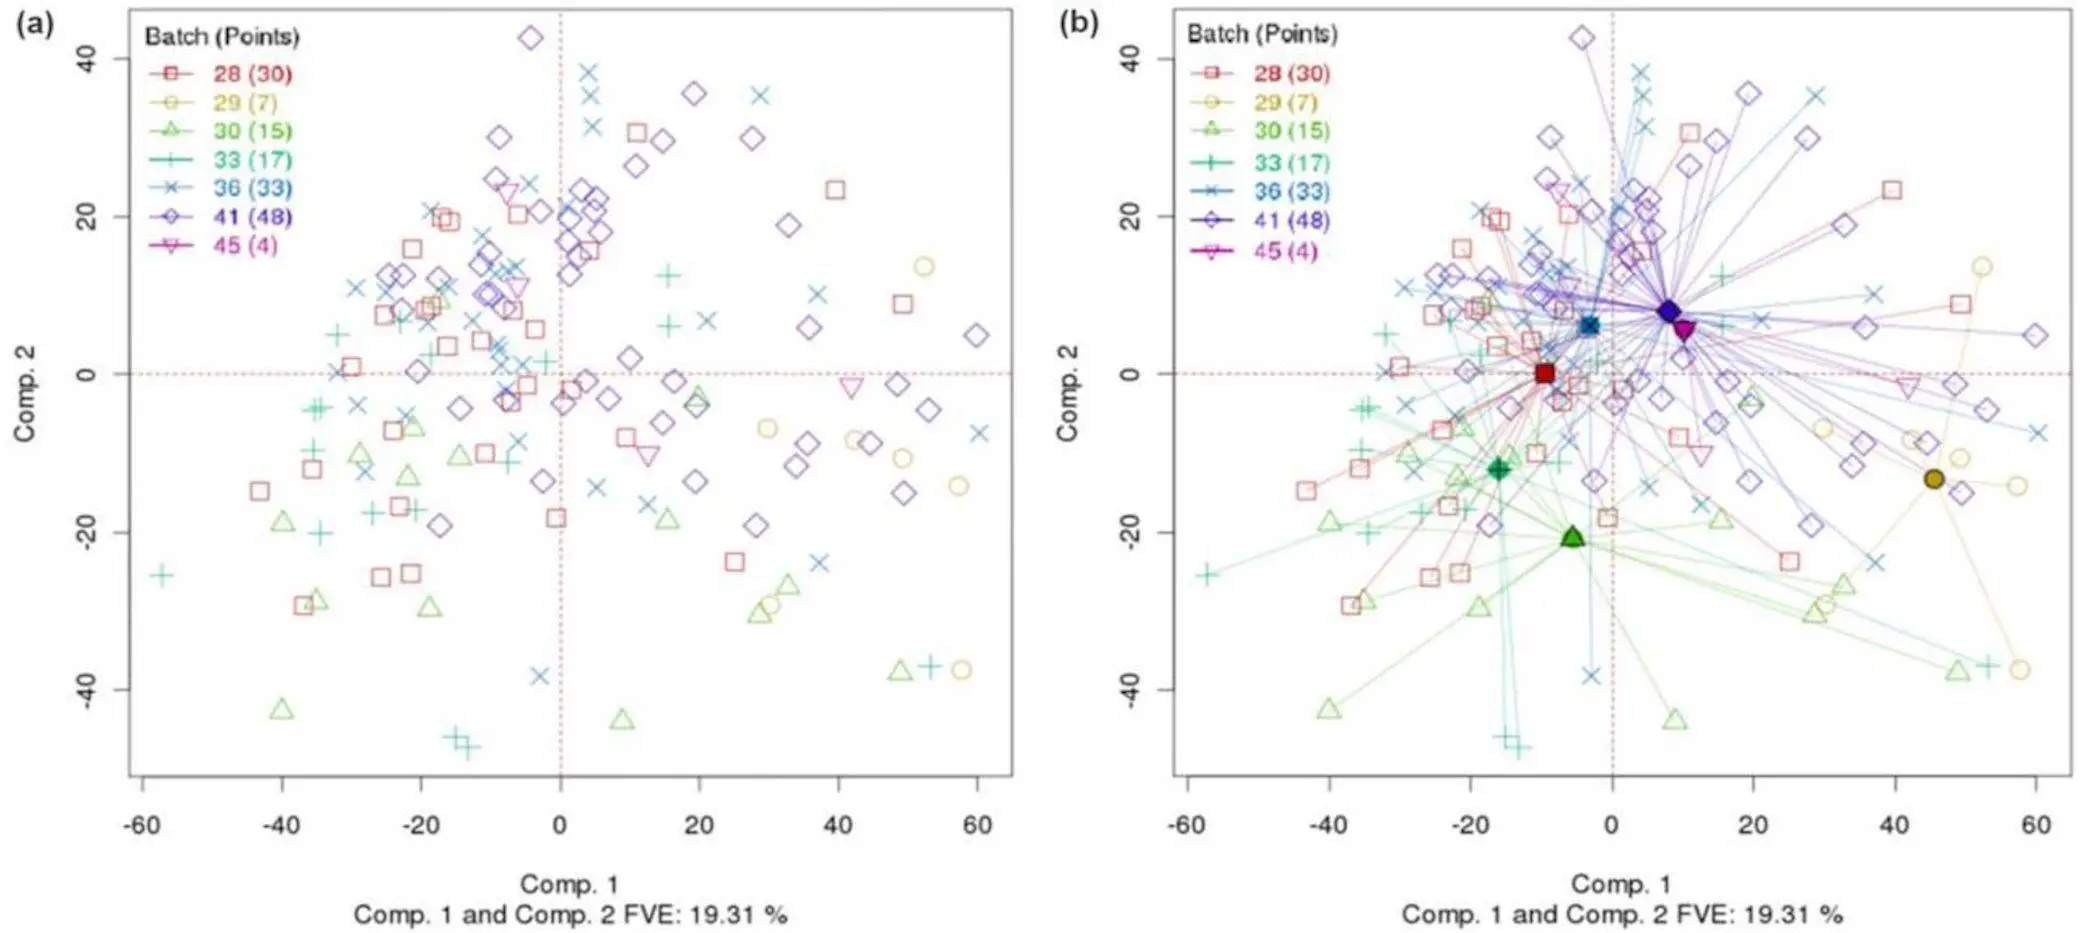
To address these limitations, researchers presented algorithms and a software package, “PCA-Plus”. The purposeful enhancement makes the plots more readable and introduces a new metric, the dispersion separability criterion (DSC), to quantify global dissimilarities among groups of data.
The key enhancements in PCA-Plus include
- Computed group centroids: PCA-Plus calculates the average location of each group in the PCA space. Making it easier to identify potential clustering or separation between groups by showing their locations explicitly.
- Sample-dispersion rays: PCA-Plus Illustrate the spread of samples within each given group. It shows the same plot as PCA but with batch centroids and rays extending from the centroids to within-batch data points, helping us to identify if groups are tightly clustered or loosely distributed.
- Differential coloring: PCA-Plus visually distinguishes groups and trends by assigning different colors to groups, trends, and individual data points, unlike PCA, which uses a single color for all data points.
- Trend trajectories: PCA-Plus highlights systematic changes across samples by drawing trajectories through the data points within a group, making it easy to understand how data points evolve or differ within the group.
- Novel separation index (DSC): Dispersion separability criterion (DSC) quantifies the degree of separation between groups by assigning them numerical values. This allows us to compare the groups statistically, which helps us determine whether the observed value is significant or just a random fluctuation.
By combining these enhancements, PCA-Plus outperforms the traditional PCA, making it a powerful visualization tool and platform for insightful group data analysis. It will become a valuable tool for researchers by offering clearer visualization, better trend detection, and measurable differentiation.
Thanks to the enhanced and modified features of PCA-Plus and its ability to analyze complex, multi-dimensional data, it opens the path for a wide range of bioinformatics applications. PCA-Plus also holds immense potential beyond bioinformatics, like in finance and economics; it can be used in market analysis, customer segmentation, and fraud detection. With the help of PCA-Plus, we can even analyze social and demographic patterns to study social science and humanities.
Bioinformatics and Biomedicine Applications
- Quantifying batch effects: Technical variations between batches can introduce noise and skew analysis in large datasets like TCGA. PCA-Plus detects these batch effects through advanced algorithms and techniques, allowing correct analysis.
- Identifying tumor subtypes and disease progression: PCA-plus, with the use of differential coloring and trend trajectories, highlights distinct clusters and sub-populations within tumor samples. This is helpful in classification and understanding of disease progression.
- Analyzing genomics data: PCA-Plus visualizes gene expression patterns across different conditions or cell types with the help of Group centroids and dispersion rays, making it easy to point out potential therapeutic targets.
Environmental Science and Ecological Applications
- Clustering species communities and identifying environmental gradients: With the help of PCA-Plus, we can form group centroids and dispersion rays, which help in identifying the coexistence between different species and their responses to environmental changes.
- Analyzing pollution patterns and ecosystem dynamics: PCA-Plus aids in environmental monitoring and finding conservation effects with the help of DSC and trajectories, which track the pollutant spread and map changes in vegetation over time.
Conclusion
Standard PCA (Principal Component Analysis) has long been used by researchers for data explorations and for providing valuable insights into multi-dimensional datasets. However, its limitations have always created problems in visualizing subtle differences and calculating group differences. To tackle these limitations and problems, a group of researchers from the USA made innovative enhancements to existing PCA and brought up a powerful new toolbox for people all around the world to tackle problems in their diverse fields.
PCA-Plus has many key features, such as enhanced visualization capabilities and group centroids, which help reveal the location and trajectories of distinct data clusters. It also uses different coloring techniques, allowing immediate recognition of unique groups and trends. These enhancements helped researchers to identify unexpected dichotomies, leading to the discovery of novel relationships within the given data. PCA-Plus is much more than this dispersion separability criterion (DSC) metric, and its accompanying permutation test helps quantify the degree of separation between groups, which helps ensure whether the observed differences are real or just mere fluctuations.
The impact of PCA-Plus is evident in its contributions to The Cancer Genome Atlas (TCGA) project; its ability has proved to be invaluable. By pinpointing the technical shreds of evidence that could skew analysis, it proved to be a crucial tool for preserving biological differences by balancing algorithmic correction.
With its broad applicability across different fields like bioinformatics, ecology, and so on, it represents a significant advancement in data exploration and analysis. With its help, we can expect a leap in novel discoveries and insights.
Article Source: Reference Paper
Important Note: bioRxiv releases preprints that have not yet undergone peer review. As a result, it is important to note that these papers should not be considered conclusive evidence, nor should they be used to direct clinical practice or influence health-related behavior. It is also important to understand that the information presented in these papers is not yet considered established or confirmed.
Learn More:


Anchal is a consulting scientific writing intern at CBIRT with a passion for bioinformatics and its miracles. She is pursuing an MTech in Bioinformatics from Delhi Technological University, Delhi. Through engaging prose, she invites readers to explore the captivating world of bioinformatics, showcasing its groundbreaking contributions to understanding the mysteries of life. Besides science, she enjoys reading and painting.


