
A recent study published in Nature Communications comprehensively evaluated computational methods used for spatial transcriptomics data analysis. The scientists investigated how well various advanced computer methods performed on real and simulated datasets and recommended which method to use depending on the type of analysis required. The guidelines may be helpful to researchers who want to improve the accuracy of their cellular analysis and understand complex tissue structures. The study has the potential to significantly transform how researchers approach spatial transcriptomics, ultimately advancing the understanding of how cells function in different tissues.
Significance of Spatial Transcriptomics
Traditionally, gene expression is measured in bulk tissues providing an average mRNA expression level of mRNAs across all cells and all cell types in the tissue. Contrarily, spatial transcriptomics examines the cells’ gene expression within their native microenvironment, i.e., in their tissue context. More specifically, it provides crucial information about the spatial arrangement of cells and how cells interact with other cells/components in tissue. Therefore, this innovative and powerful technique is essential to understanding tissue’s complete biological function, underpinning disease mechanisms, and opening the door to further transcriptomics research. However, the generation of complex datasets presents a significant challenge to accurately identify and analyze specific individual cell types within heterogeneous tissues.
Hence, computational techniques, like cellular deconvolution, are crucial to address this issue. In fact, their importance in providing information about the different cell types is highlighted by the enormous demand for high-throughput spatial transcriptomics technologies incorporating cellular deconvolution.
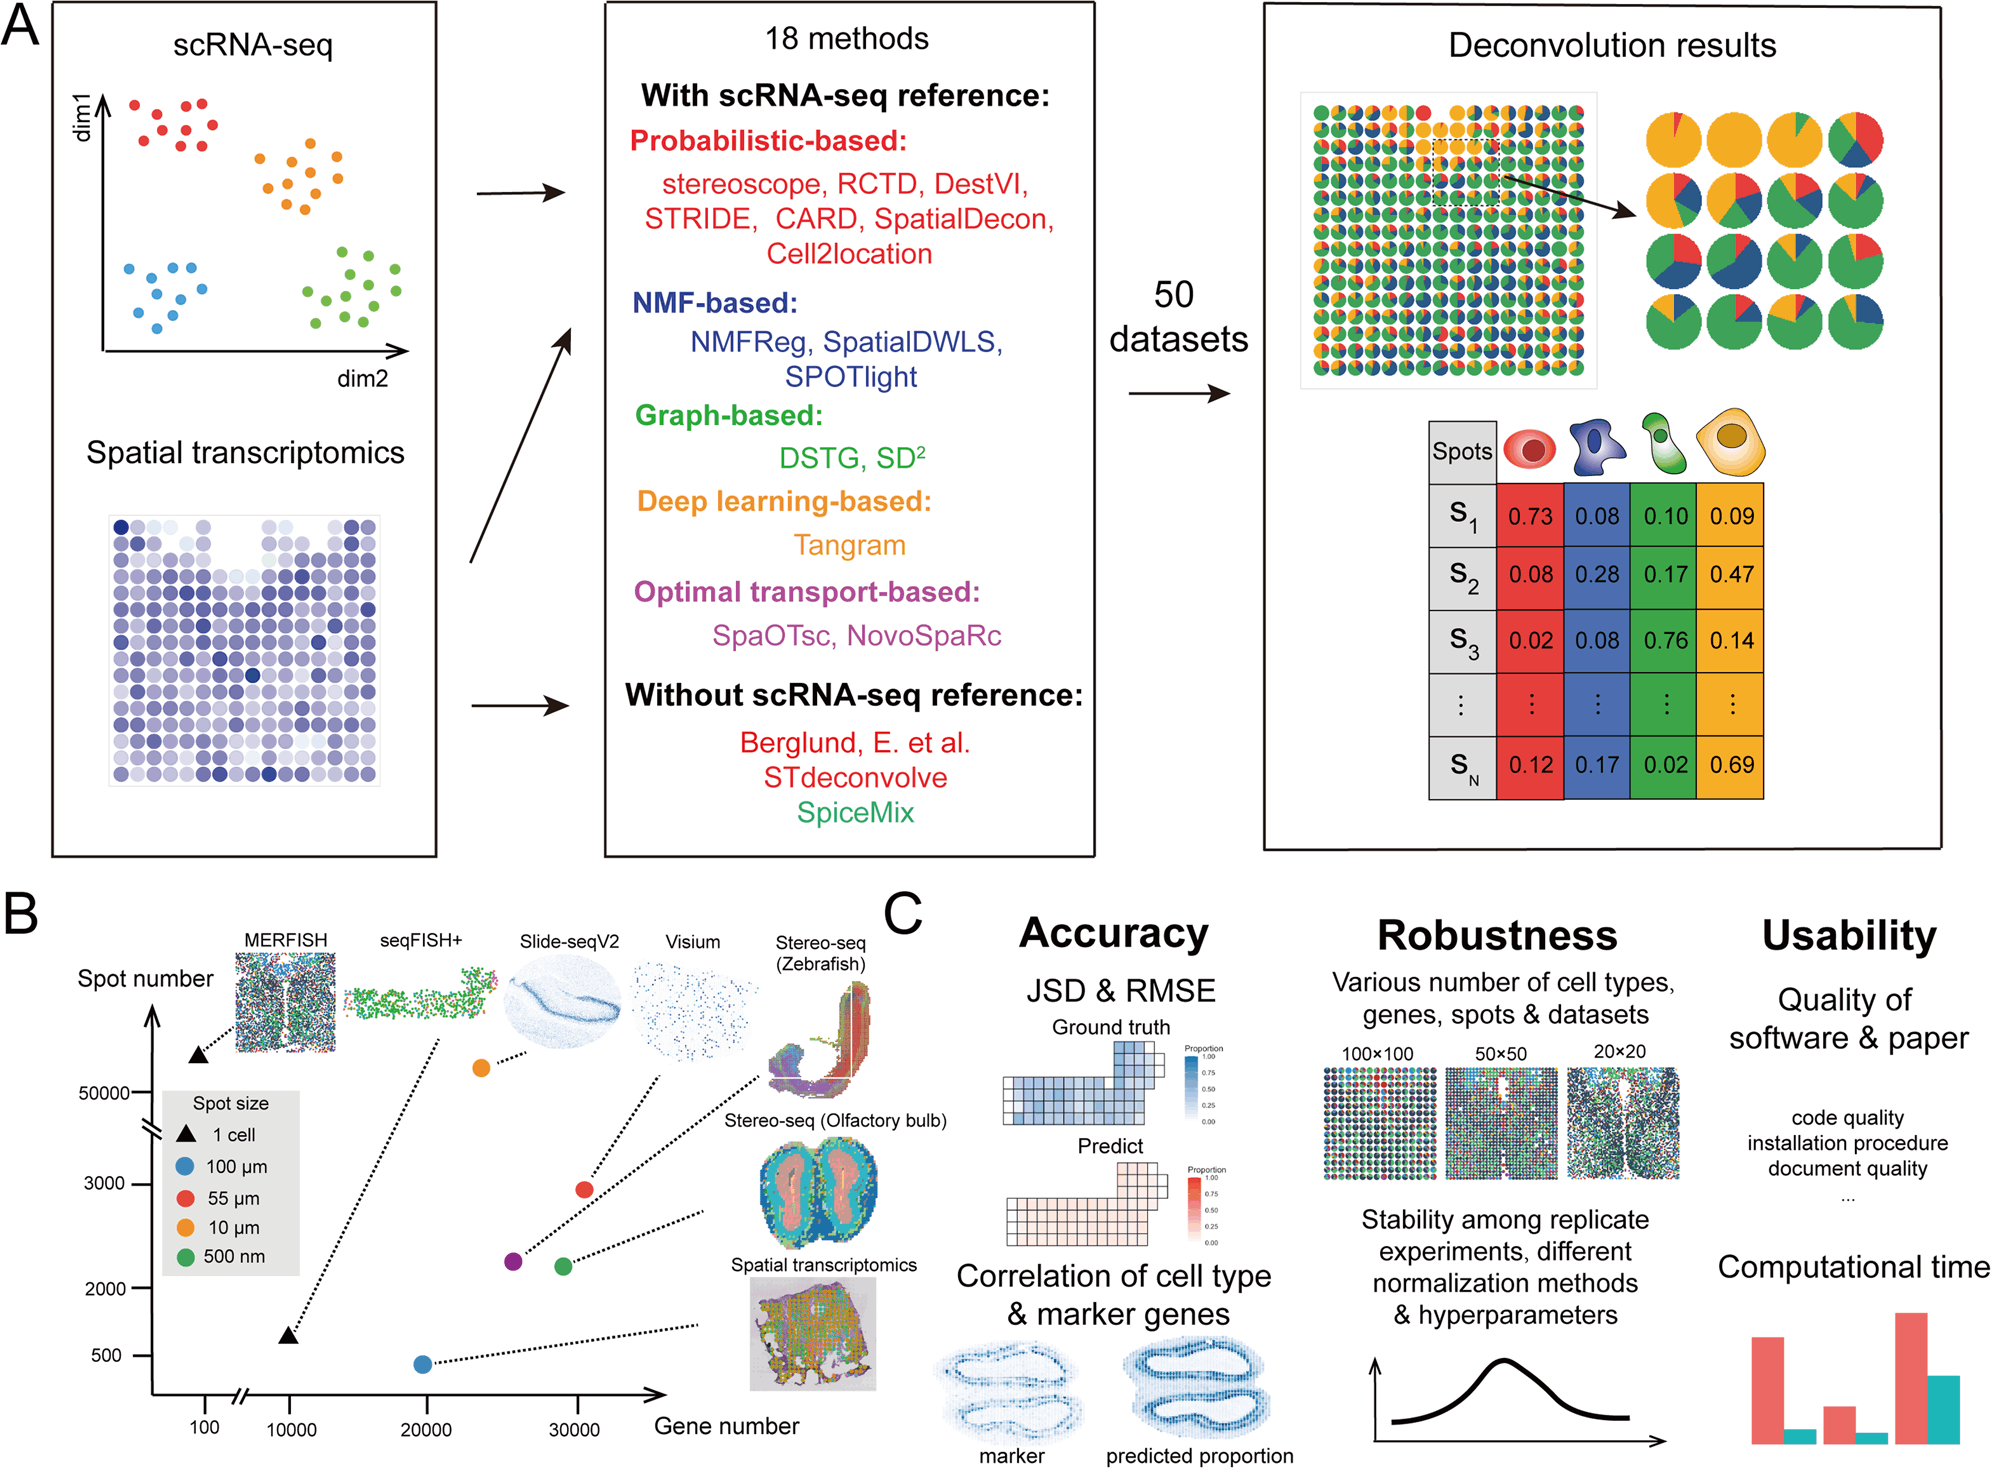
The study by Lin et al. evaluated 18 different deconvolution techniques which can be used to analyze image-based and sequencing-based spatial transcriptomics data from simulated and real datasets. Examples of datasets include seqFISH+, MERFISH, 10X Visium, etc. More importantly, the study provides a comprehensive guideline for researchers in selecting the most appropriate computational method for different situations.
Deconvolution Methods
The 18 methods could be classified broadly into five categories; probabilistic-based, non-negative matrix factorization-based (NMF-based), deep learning-based, graph-based, and optimal-transport-based (OT-based). They were assessed based on the following three parameters; accuracy, robustness, and usability. Several metrics were used to quantify each of these parameters. The accuracy of the methods was assessed under different conditions, such as different cell type mixtures, various sample sizes, and expression profiles, and these were evaluated by metrics such as the absolute mean error and correlation coefficients. The usability was tested based on the quality of documents, publications, code, computational demand, and efficacy. Lastly, the robustness was examined on varying cell type mixtures, number of genes, spots, and datasets.
Assessment of Deconvolution Methods
- Accuracy
Several metrics were used to quantify accuracy, including root-mean-sequare-error (RMSE), Pearson correlation coefficient (PCC), and Jensen-Shannon diversion (JSD) score. For most methods, the accuracy depended on the data source and its specific characteristics. For example, SpatialDWLS performed decently with stimulated datasets but showed low accuracy with real-world datasets. Another instance is that SpatialDecon and Tangram were most proficient with only extensive views of tissues. However, other methods demonstrated high accuracy consistently in the different datasets with varying characteristics, such as DestVI and Cell2location. These results clearly show that the dataset’s characteristics should dictate the deconvolution method in order to obtain high-accuracy results.
- Robustness
For evaluating robustness, the authors randomly selected different numbers of genes in each dataset. They tested their methods on 17 original cells and 11 integrated cell types and assessed the relative performance between the two normalization techniques. The findings suggest that most methods, except a few like SpiceMix, were robust with the seqFISH+ dataset. Also, other general trends were observed. For instance, the robustness of most methods, if not all, became poorer as the number of spots increased. Regardless of the dataset, the top three performing methods were Tangram, Stereoscope, and DestVI.
- Usability
The usability was characterized based on the method’s user-friendliness and computational efficiency. Not all methods were tested, but Tangram, STRIDE, and NMFreg were the most efficient among those that were! It is also worth mentioning that some methods like CARD, RCTF, and DestVI provide helpful tutorials which make them more user-friendly.
Method Selection Guideline
The authors developed a decision–tree-based scenario-specific framework/guideline for selecting methods based on the findings. Mainly four scenarios were evaluated, and three methods were suitable and ideal for each scenario. In most scenarios (where scRNA-seq data is available for the tissue), Tangram is a recommended candidate, highlighting its potential in deconvolution. Other best-performing methods were CARD and RCTD.
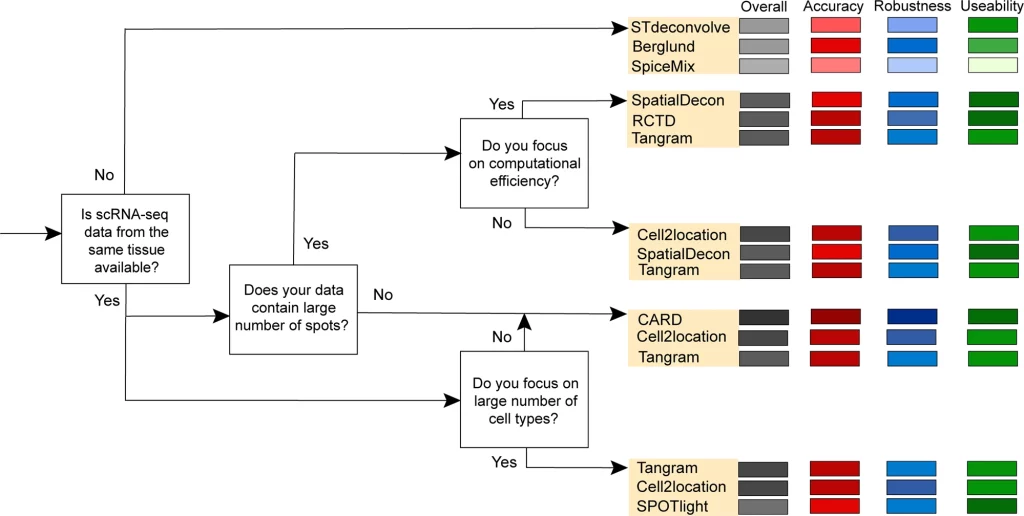
Image Source: https://doi.org/10.1038/s41467-023-37168-7
Implications of Selecting Appropriate Deconvolution Methods
The findings of the study provide researchers with a well-established guideline helping them select an appropriate, accurate, and robust deconvolution method that they can use to analyze their spatial transcriptomics data. Furthermore, the study’s findings can also mediate further development of novel cellular deconvolution methods which are more efficient and accurate. Overall, the study allows for a more accurate and robust analysis of spatial transcriptomics data, which can provide significant insights into the spatial organization of cells within tissues, even those that are heterogeneous.
In particular, improvements in spatial transcriptomics data analysis can have implications in disease research, specifically aiding the identification of therapeutic targets and biomarkers. This is because characterizing disease-specific gene expression patterns and cell types within heterogeneous tissue is often a gap in our understanding of human disease. Therefore, appropriate and improved computational deconvolution methods could lead to the development of more effective biomarkers, therapeutic drugs, and personalized medicine.
Limitations of Spatial Transcriptomics
Despite its crucial findings, the study does possess certain limitations. One such major limitation is the platform effect which effectively causes discrepancies in gene expression profiles between spatial transcriptomics data and scRNA-seq. Another limitation is the high dropout rate of spatial transcriptomics, which means that some coding genes remain undetected for cell types of low abundance. It is only obvious that these issues must be addressed in further studies/research.
Conclusion
To conclude, the study provides valuable insights into the accuracy, robustness, and usability of existing computational deconvolution methods used in spatial transcriptomics. The scientists used sufficient datasets and a multi-metric approach for assessment allowing the development of a potentially fundamental guideline in spatial transcriptomics research. It provides researchers with a guideline based on their research question and tissue of interest. However, further study must be undertaken to address the two key limitations in this field. Regardless, this field has opened the door to understanding biological systems in a more complex way and could aid combat diseases.
Article Source: Reference Paper
Learn More:


Diyan Jain is a second-year undergraduate majoring in Biotechnology at Imperial College, London, and currently interning as a scientific content writer at CBIRT. His passion for writing and science has led him to pursue this opportunity to communicate cutting-edge research and discoveries engagingly to a broader public. Diyan is also working on a personal research project to evaluate the potential for genome sequencing studies and GWAS to identify disease likelihood and determine personalized treatments. With his fascination for bioinformatics and science communication, he is committed to delivering high-quality content a CBIRT.


