

Trying to visualize available genomic data is of great interest. Currently, there exists a lot of specialized visualization tools, but most need to be tailored for a certain cause—the cost and labor increase since these applications need extensive programming done by bioinformaticians and software developers. Biological research is awash with large, complex, multilayered datasets that span information layers from genomic sequences through gene expression profiles and, last but not least, encompassing epigenetic modifications. Researchers from Helsinki University Hospital, the University of Helsinki, and the University of Turku present one of the challenges and introduce a new tool developed to be applied with the above-mentioned data scale and complexity.
Why do we need Advanced Visualization Tools?
Biological information, mostly genomic, is intrinsically multilevel and multilayered. As an example, a single genome may be probed and understood at the level of its DNA sequence, its expression in genes, and even its epigenetic marks. Genomes of cancers are one of the most relevant challenges in modern genomics. This is mainly due to the fact that high-throughput sequencing technologies generate a huge quantity of data. Traditional methods generally become incapable of providing any intuitive insight into this data; therefore, GenomeSpy comes into play. It is an interactive visualization toolkit developed for the exploration, analysis, and presentation of genomic data in an understandable format.
GenomeSpy: A New Approach
A solution to these issues is GenomeSpy. GenomeSpy is an interactive and multiscale visualization tool that enables researchers to explore and investigate large and multilayered biological datasets with ease. Admittedly, GenomeSpy shows the ingenuity of expressing complex data structures due to advanced visualization techniques and the apparent ease of use in interactions.
How it Works
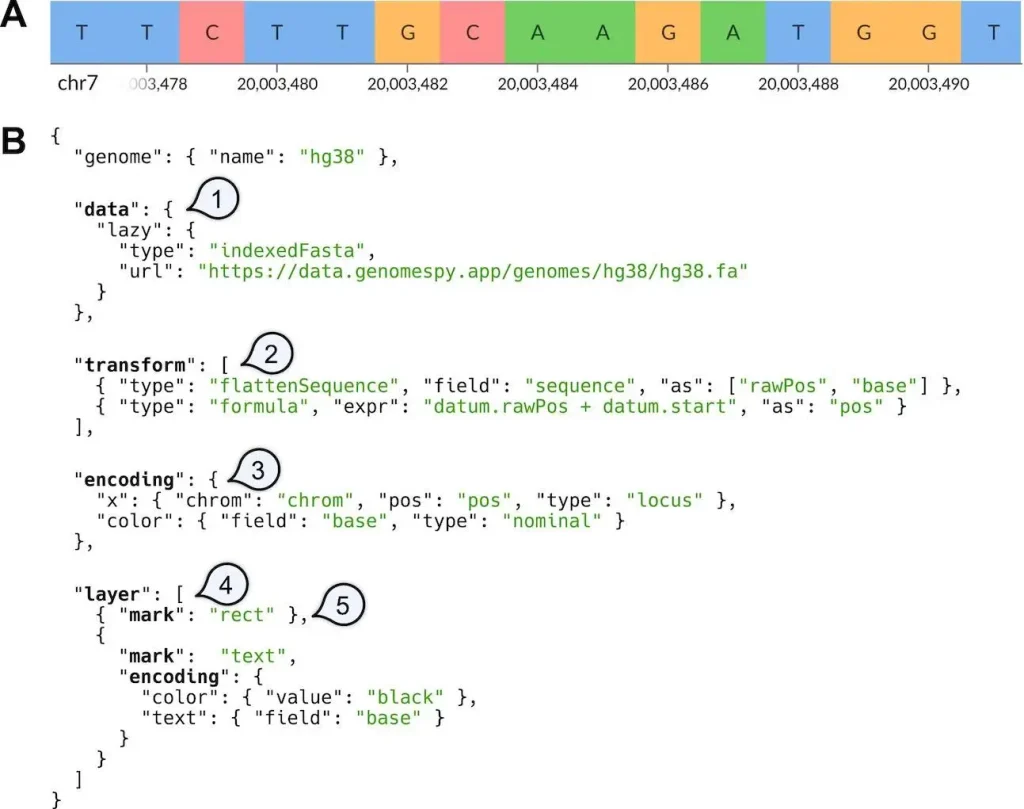
GenomeSpy is a JavaScript-based toolkit for easily building interactive visualizations in genome analysis. It offers a way to enable developers and bioinformaticians to build such visualizations. A user builds such visualization by writing a specification for the visualization in JavaScript Object Notation format, which conforms to the rules of the visualization grammar. The main component of the toolkit is the core library. This implements the grammar and renders a visualization based on the specification provided. Below is a visualization of how this works.
Features of GenomeSpy:
GenomeSpy uses hierarchical data structures to maintain complex relationships within genomic datasets. The structure of the visualization is done using WebGL, which assures that even large data sets can be easily visualized within a web-based environment.
Another key GenomeSpy feature is interactivity. The user can rotate the visualizations in real-time and change parameters and filters to zoom in on interesting features. On the other hand, interactivity is extremely important for genomic data investigation. This gives researchers the capability to formulate hypotheses and test them on the fly.
Results
GenomeSpy identified several key aspects in the application domain of cancer genomics (High-grade serous carcinoma). The case studies (including 753 whole-genome sequencing (WGS)
samples from 215 patients) used GenomeSpy in the analysis of cancer genomes. The toolkit was applied to search for novel genomic aberrations in those patients and correlate these with clinical outcomes. They used it to visually inspect the loci of BRCA1 and other homologous recombination deficiency-related genes in their samples and identified a BRCA1 region for one patient. A copy number pipeline confirmed a multiexon in-frame deletion of BRCA1 in all sequenced tumor samples from this patient! GenomeSpy was able to identify potential mutations visually.
Hence, the visualizations generated were not only informative; the tool has also unveiled patterns that otherwise couldn’t be detected by traditional analysis methods. Among other things, the tool could identify complex structural variations associated with drug resistance in cancer patients. Such insights can be useful for the development of new therapeutic strategies.
Another consideration regarding cancer research is that the value of GenomeSpy in the future is enhanced to the extent that multi-omic data—genomics, transcriptomics, and proteomics, among others—can be integrated. With a holistic view of the molecular landscape, GenomeSpy empowered researchers with better decisions and models on cancer progression.
Discussion
It elaborates on the impact of GenomeSpy in cancer genome analysis. First and foremost, the authors believe that this toolkit is among one of the most significant breakthroughs in this discipline, especially for democratizing access to complicated genomic data. Thus, with enhanced accessibility and interpretability of these data, GenomeSpy can help speed up discoveries in cancer research.
The study has also underlined a portion of the challenges encountered during GenomeSpy development, one of which was the need to balance performance with interactivity. According to the authors, all these were largely overcome by advanced computational techniques and optimizations.
Conclusion
In a nutshell, GenomeSpy is an extremely versatile and powerful tool in cancer genome analysis. It is an enormously valuable resource for any researcher as long as they can interpret and visualize very large, potentially very complex, genomic data. Results obtained using GenomeSpy will prove that it is not less effective in fostering new discoveries in cancer genomics and bringing new data to personalized medicine. As genomic data becomes more complex and large, GenomeSpy and such tools will be at the forefront in making sense of it and turning it into something actionable.
Article Source: Reference Paper | GenomeSpy is available at the Website
Follow Us!
Learn More:


Neermita Bhattacharya is a consulting Scientific Content Writing Intern at CBIRT. She is pursuing B.Tech in computer science from IIT Jodhpur. She has a niche interest in the amalgamation of biological concepts and computer science and wishes to pursue higher studies in related fields. She has quite a bunch of hobbies- swimming, dancing ballet, playing the violin, guitar, ukulele, singing, drawing and painting, reading novels, playing indie videogames and writing short stories. She is excited to delve deeper into the fields of bioinformatics, genetics and computational biology and possibly help the world through research!


