
In genomics, we need to understand the gene content of an organism to understand its true biology. This is essential for large eukaryotic genomes, such as the human genome, which encompasses approximately 20,000 protein-coding genes. Currently, tools have been developed to identify gene content changes in bacterial genomes, but none apply to the human pangenome. For this, Pangene has been introduced by researchers from Harvard Medical School and the Massachusetts General Hospital as a wonderful computational tool to identify and analyze gene content variations across many genomes.
Introduction to Pangene
Protein-coding genes can exhibit significant variations between individuals, influencing a multitude of biological processes, including immune responses, brain functionality, drug metabolism, and susceptibility to diseases. Researchers have developed many tools to analyze these variations, but they have their limitations. For example, tools like minigraph and minigraph-cactus, used by the Human Pangenome Reference Consortium (HPRC), usually miss genes in complex genomic regions and long segmental duplications. Also, researchers said that PGGB tends to collapse paralogous genes (genes that originate from a common ancestral gene and have evolved to acquire new functions), making it difficult to study individual paralogs. Moreover, these tools do not directly reveal how genomic variations impact genes. Pangene was developed to fix this, which gives easier solutions for exploring gene content variations in large eukaryotic genomes.
How Pangene Works
Pangene takes a set of protein sequences and multiple genome assemblies as input and outputs a graph in GFA format.
Let’s try to understand:
Firstly, input protein sequences and genome assemblies are aligned using miniprot.
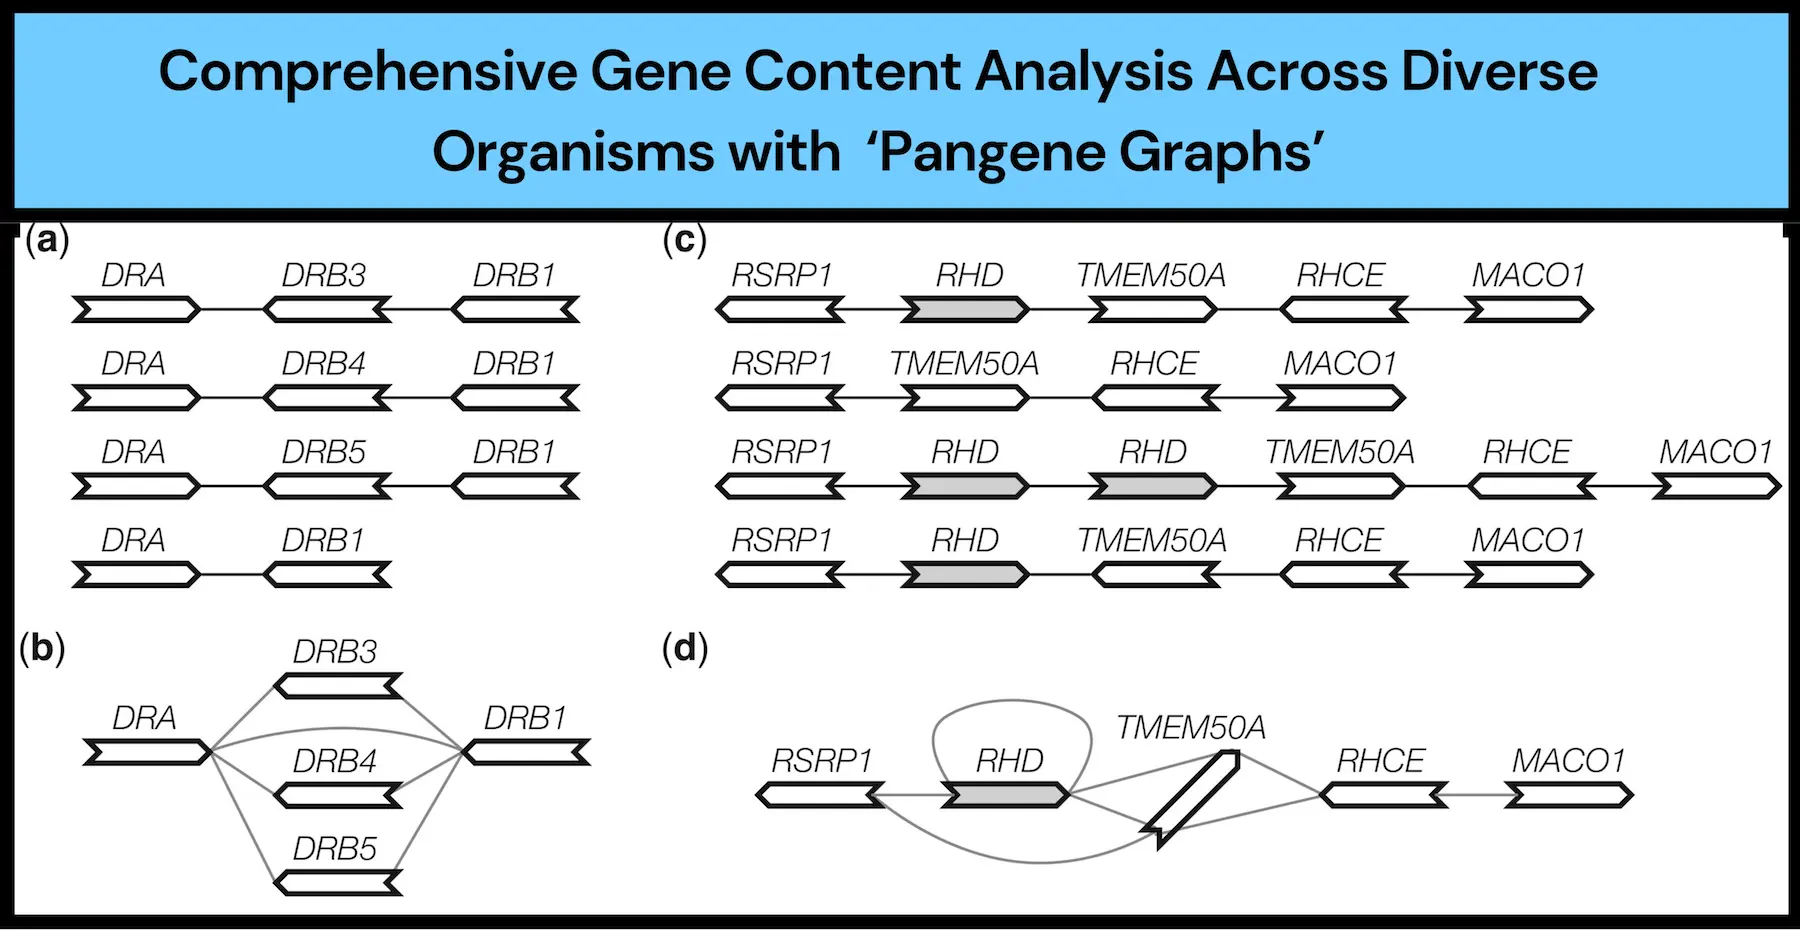
It then creates a gene graph from the alignments. Correspondingly, each genome is represented as a walk. This allows Pangene to capture the gene order, orientation, and copy-number changes. This is further facilitated by the fact that miniprot can align through in-frame stop codons and frameshifts. Hence, insertion or deletion errors do not change things much in the input genomes.
The Gene Graph
Pangene forms a bidirected gene graph, which uses simple notations where vertices represent the genes and edges mark their relationships. The genome walk on the graph thus essentially visualizes the variations in the contents of the genes. Other key visualizations are the local changes in the order, the copy-number or the orientation, that are captured as subgraphs by the tool and are referred to as bibubbles, say researchers.
Handling Redundancies and Errors:
Pangene solves the inherent problematic issues: redundant sequences, paralogous genes, and assembly or alignment errors. The algorithm of selecting a couple of non-orthologous genes helps in distinguishing and identifying core genes and accessory genes, the former being generally in most of the input genomes, while the latter is not typically.
As noted, an application of Pangene to the human pangenome succeeded in identifying the already known gene-level variations and revealed complex haplotypes. Pangene can identify genomic variations that traditional tools may miss! Furthermore, running Pangene with high-quality bacterial pangenomes returned similar numbers of core and accessory genes to existing tools.
Advantages Over Existing Tools
Pangene has numerous advantages over the tools that are already in use. While all the existing bacterial pangenome pipelines tend to direct their focus on the annotation of protein-coding genes based on gene sequences, Pangene uses the alignment of protein sequences to genomes to annotate the respective genes, making it an effective way to obtain a broader analysis of genomic variations. It also constructs the bidirected graphs, therefore having a more generalized set.
Is It Useful? Case Studies on Pangene
Human Pangenome
In the human pangenome project, Pangene was used to study gene content variations among divergent human genomes. It was found to have multiple changes at gene levels, most of which comprise the densest complex genomic regions, often poorly covered by other tools. For instance, Pangene discovered gene variations in the very important MHC region, which is responsible for the immune response and able to provide fine-grained information on the functionally important genomic region.
Bacteria Pangenomes
The utility of Pangene was further justified when the application was compared with bacterial pangenomes. Pangene performed a comparison of multiple strains of bacteria and identified core genes common to all strains and accessory genes unique to a particular strain. All of these key features make it valuable for use in understanding bacterial evolution, pathogenicity, and antibiotic resistance, while providing a worldwide view of genetic diversity in bacteria.
Challenges and Future Prospects
All applications above are highly encouraging, but there are still a couple of challenges pertaining to the implementation and application of Pangene. Although researchers provided a rigorous definition of a “bubble” in a bidirected graph, no efficient algorithm to identify generalized bibubbles was found. Although the current implementation in Pangene works for gene graphs containing ∼20,000 genes, it will be slow for a graph containing tens of millions of nodes. Efficient identification of generalized bibubbles is, hence, a problem yet to be improved. Also, “bubbles” cannot model rearrangements at the chromosome scale. How to navigate a multi-species gene graph or an alignment graph, in general, is yet another direction for future work. Maybe researchers can work on this topic? We hope so!
Conclusion
Pangene can be considered a significant step further in the research of genomic variations. It is able to handle large eukaryotic genomes, capture complex gene content changes, and, most of all, gain a generalized representation of genomic variations that any researcher cannot dispense with. Using Pangene makes gene order, orientation, and copy-number changes accessible in large detail, so gene content across many diverse genomes can be understood in a better way.
Article Source: Reference Paper | Source code is available on GitHub | Pre-built pangene graphs can be downloaded from Zenodo | Visualization can be done at the Website.
Follow Us!
Learn More:


Neermita Bhattacharya is a consulting Scientific Content Writing Intern at CBIRT. She is pursuing B.Tech in computer science from IIT Jodhpur. She has a niche interest in the amalgamation of biological concepts and computer science and wishes to pursue higher studies in related fields. She has quite a bunch of hobbies- swimming, dancing ballet, playing the violin, guitar, ukulele, singing, drawing and painting, reading novels, playing indie videogames and writing short stories. She is excited to delve deeper into the fields of bioinformatics, genetics and computational biology and possibly help the world through research!


