

Scientists from the University of Edinburgh developed an open-source platform, ‘Graphia’, for the graph-based visualization and analysis of the high dimensional data being produced from research on cells, genes, proteins, and metabolites.
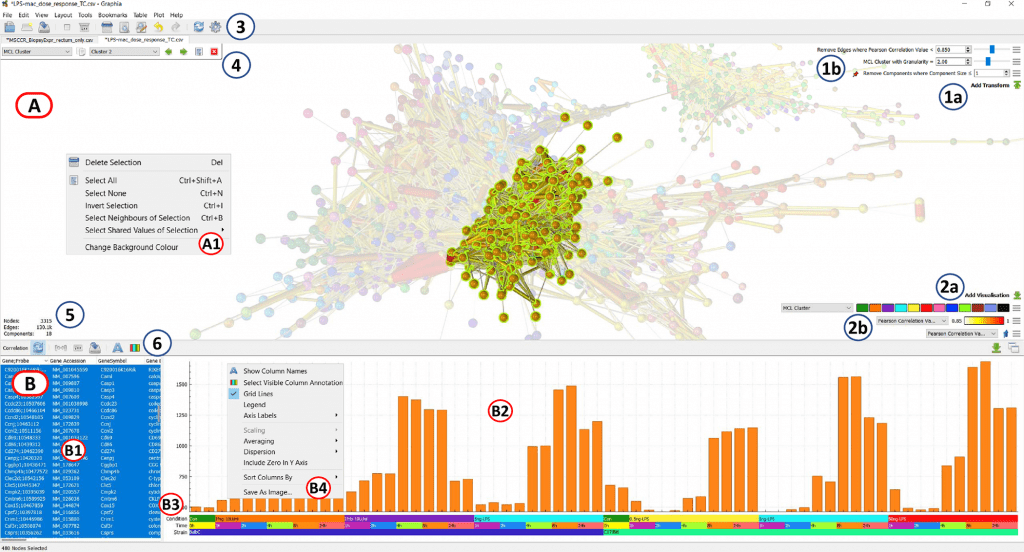
Image Source: https://doi.org/10.1371/journal.pcbi.1010310.g006
A brand-new visual analytics platform called Graphia was developed especially for network-based analysis of enormous and complicated data, such as the vast volumes of data produced by contemporary biological research.
It generates correlation networks from any table of numerical or discrete values in a data-independent, hypothesis-free manner and then offers a way to quickly visualize the frequently very massive networks that arise in either 2D or 3D space.
After network design, the program provides a wide variety of analytic techniques, network transformation routines, and metadata visualization options.
In addition to any data that has previously been characterized as a network, this offers a potent analysis solution for the discovery and understanding of high-dimensional data from any source.
To demonstrate Graphia’s diverse range of uses in the study of biological data, several use cases were discussed. Open source and free to use, Graphia is a desktop application that can be downloaded from https://graphia.app/. It is compatible with all of the main desktop operating systems and is extendable through the use of plugins.
The Need for a Tool like Graphia
Modern analytics is built on the analysis of interactions between entities.
For quite some time, various complementary methods have been used in biology to map the “interactome”: all the interactions between the different parts of a biological system.
Biological data networks can be used to map a variety of events, including the transmission of disease, interactions between medications and their targets, and relationships across species through time. Numerous data from different industries have graph-based structures naturally.
A few examples of real-world systems are interactions on social media platforms, client/customer relationships, communication and transportation systems, computer networks, and many others.
Graph-based methods can also be used to analyze numerical data matrices that do not already have a network structure.
A graph can be created using high confidence measures to define the edges between elements, represented by nodes, wherever it is possible to quantify the distance between things.
Such a method is now utilized extensively in biology to analyze high dimensional data, particularly to build and analyze gene coexpression networks, but it may be applied to analyze any numerical or categorical data from any source. quantity
Numerous software solutions to support these tasks have been developed in recent years as a consequence of the explosion in the amount of high dimensional data that is now available and the possibility for graph-based ways to visualize and analyze it.
Cytoscape is arguably the most used graph analytics program in the field of biology. It supports a wide range of “apps” (plugins) made by the community for the accomplishment of particular graph-based analysis tasks and has a sizable user base.
Gephi, Tulip, Bandage, Graphviz, Pajek, yEd (yFiles, Tübingen, Germany), BioLayout, Social Network Visualiser, and NodeXL are further network visualization and analysis tools.
The scientists compared some of the most popular network analysis tools. For Gephi and Cytoscape, they compared some of the most important aspects of graph visualization.
Additionally, a variety of web-based software tools, like String, GeneMania, and Neo4J Bloom, are specifically made to visualize parts of data, frequently from a designated database.
While some of these tools include features geared toward particular jobs or data types and are a combination of open-source projects and for-profit tools, others are concentrated on helping a particular community. Others share repositories of open-source code for graph visualization and analysis methods or graph data repositories.
There is an urgent need for user-friendly software that enables the quick visualization and analysis of relatively vast networks, despite the availability of a wide range of downloadable apps, web resources, and code libraries that support graph-based investigations.
The scientists created Graphia, a general-purpose graph analysis tool, to meet this need. It allows for the integration, visualization, analysis, and interpretation of a wide range of data types.
In the study, the scientists gave a general overview of the fundamental capability of Graphia for graph analysis and discussed many case studies in which it is used to address issues with the analysis of high dimensional data from the biological sciences.
Graphia: Precursors
Due to the ongoing expansion in the size and complexity of biological datasets, data-driven research has become the cornerstone of contemporary biomedical and agricultural sciences.
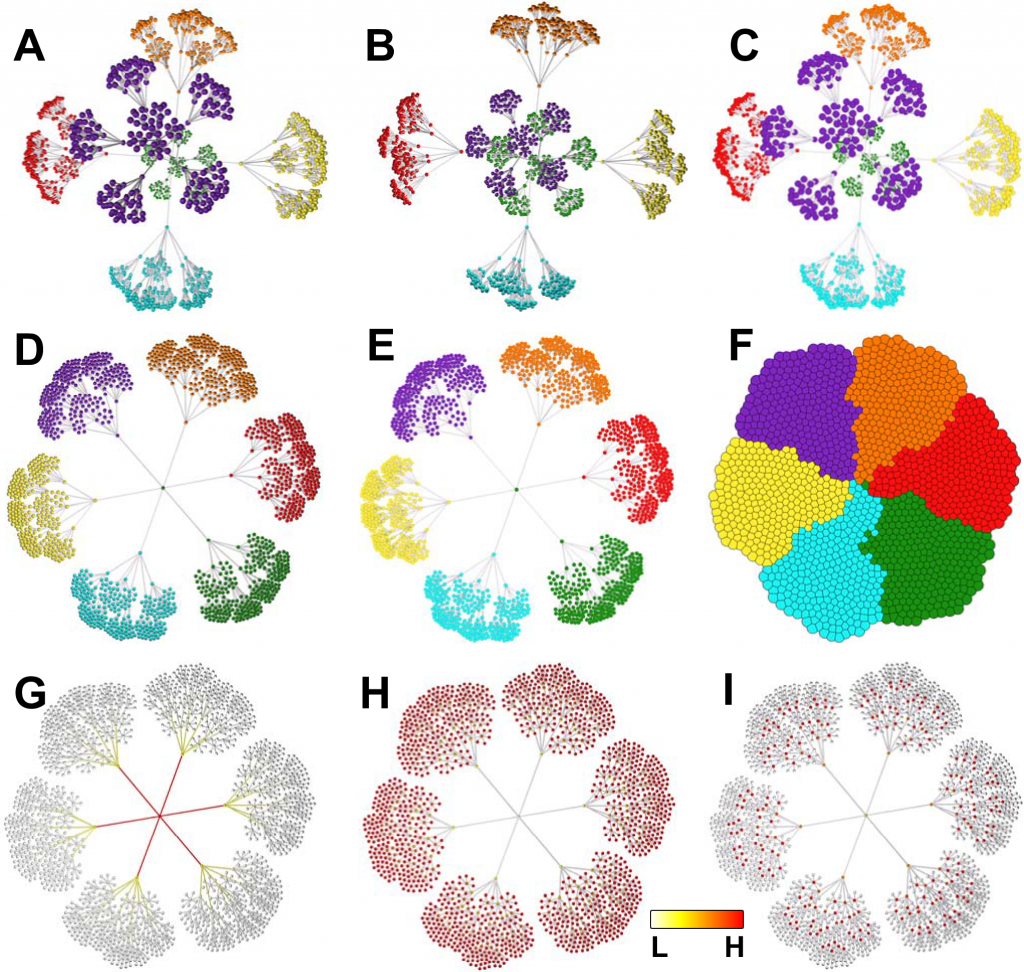
Image Source: https://doi.org/10.1371/journal.pcbi.1010310.g006
In order to test a wide range of hypotheses and conduct hypothesis-free data investigations, network analysis offers a versatile toolkit that combines visualization with algorithmic analysis of data structure.
For the analysis and visualization of big graphs, Graphia was created. The scientists were initially interested in the graph-based analysis to examine enormous correlation networks of transcriptomics data. The weighted gene coexpression analysis (WGCNA)3 results are typically displayed as a heat map or tree diagram.
BioLayout Express3D, the forerunner of Graphia, was created primarily to produce and show transcriptomic data and pathway modeling.
Numerous sizable datasets of transcriptome information from various species have been analyzed using BioLayout.
Additionally, it has been used to analyze datasets that were not initially anticipated, such as the correlation between altitude sickness symptoms and the honey bee microbiome, the comparison of dog brain morphometric measurements, and even naming trends in historical birth records.
However, the inherent restrictions in the code structure and programming language prevented the addition of new features to BioLayout (Java).
Graphia: What and How?
Graphia is a brand-new analytical platform created utilizing the C++ programming language and the Qt UI framework.
The feature of Biolayout for the investigation of any high-dimensional numerical matrix is replicated and enhanced by the correlation plugin. The foundation of Graphia’s capabilities is data visualization.
A user can more easily identify patterns, trends, and outlier groups within data with the use of effective visualizations.
The insights gained from interacting with the visualization, whether they be the identification of input data problems, technical data effects, or fresh and intriguing discoveries, determine the next stage in an investigation.
In order to make graph visualizations scalable but still responsive in real-time, Graphia is built to make the best use of the most recent accelerated graphics technology.
Graphs are typically rendered in three dimensions, which significantly improves the visualization and navigation of complex graph topologies.
The extra dimension also allows one to distinguish the distance between what might look like closely connected nodes in two dimensions.
Another fundamental idea in data visualization is the idea of “dynamic” graphs, which change as nodes and edges are added or withdrawn.
To accomplish this, unless manually interrupted, the layout algorithm runs continually. When a transformation causes a significant change in the network structure, such as the deletion of a hub node from a tree graph or the fragmentation of one graph component into several, dynamic transitions may become difficult. A user’s “mental map” may be lost if such a transition is carried out soon.
For this reason, Graphia has the ability to delay the change from one state to the next and also “flight-orients” components before reconnecting them. Graphia handles graph components dynamically in a very special way.
The Endpoint
Graphia is a general-purpose platform for the study of network data from any source, although it was developed in response to the analytical difficulties connected with data from the biological sciences.
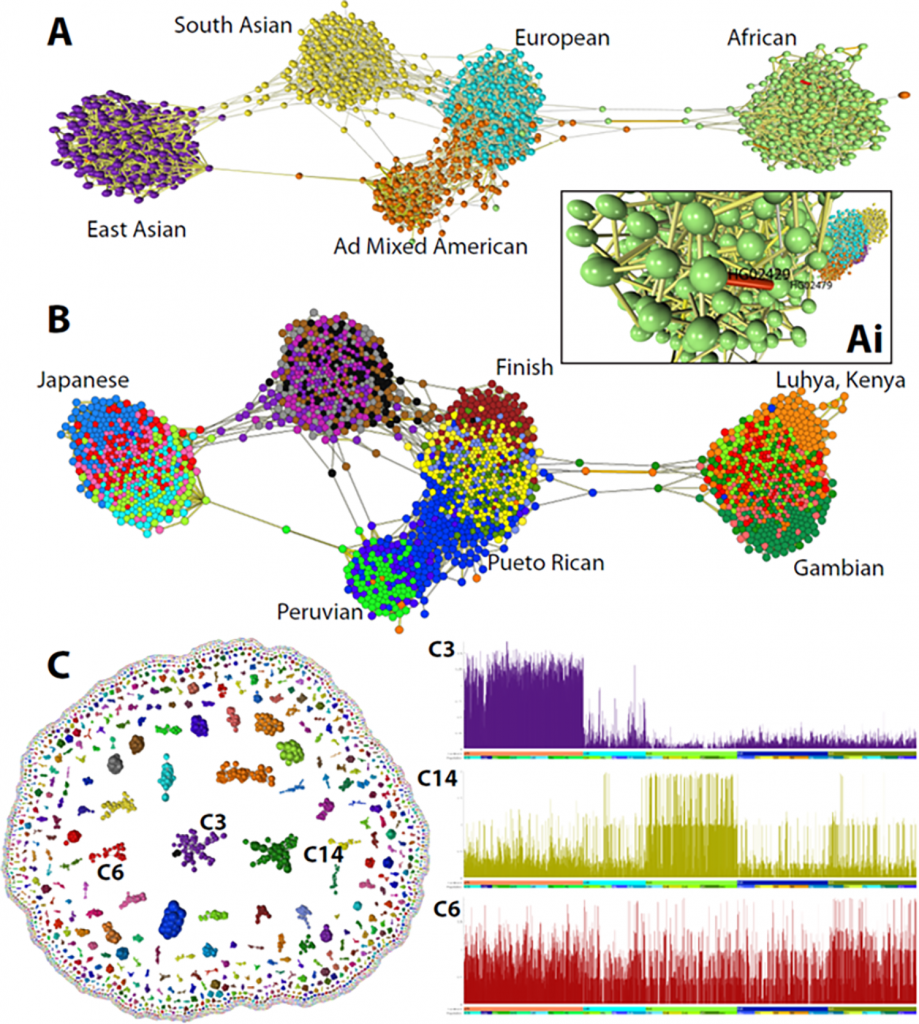
Image Source: https://doi.org/10.1371/journal.pcbi.1010310.g006
A graph can be created using input data that is tabulated (continuous or discrete numbers). Graphia offers a way to explore data that is already in a graph structure.
Although it can’t currently interface with a remote database, Graphia can load data from files or other web resources. It’s interesting to see how widely used graph databases are.
In addition to speeding up and simplifying data store searching, graph databases also facilitate data visualization and analysis by storing data as a graph.
Graph databases can be queried and seen using a growing variety of web-based tools, but none has the rendering power of Graphia for visualizing a sizable amount of the data they store.
In the given study, the scientists provided a high-level overview of Graphia’s features as well as a few illustrations of some of its numerous applications in the biomedical sciences.
Installers for all popular desktop operating systems are available, and they also give customers access to the source code so they can add additional features to the program to suit their needs better.
Article Source: Freeman TC, Horsewell S, Patir A, Harling-Lee J, Regan T, Shih BB, et al. (2022) Graphia: A platform for the graph-based visualisation and analysis of high dimensional data. PLoS Comput Biol 18(7): e1010310. doi:10.1371/journal.pcbi.1010310 https://doi.org/10.1371/journal.pcbi.1010310
Learn More About Bioinformatics:
Top Bioinformatics Books ↗
Learn more to get deeper insights into the field of bioinformatics.
Top Free Online Bioinformatics Courses ↗
Freely available courses to learn each and every aspect of bioinformatics.
Latest Bioinformatics Breakthroughs ↗
Stay updated with the latest discoveries in the field of bioinformatics.
Tanveen Kaur is a consulting intern at CBIRT, currently, she's pursuing post-graduation in Biotechnology from Shoolini University, Himachal Pradesh. Her interests primarily lay in researching the new advancements in the world of biotechnology and bioinformatics, having a dream of being one of the best researchers.


