Molecular and phenotypic responses to numerous perturbations are revealed by the increasing number of single-cell perturbation studies. However, variations in format, naming conventions, and data filtering frequently make it difficult to analyze data across varied databases. In order to aid in the advancement and evaluation of computational techniques in systems biology, 44 datasets featuring molecular readouts that are accessible to the public are gathered. The implementation of consistent pre-processing and quality control procedures facilitates the effective creation and evaluation of computational analytic techniques. The scPerturb dataset collection and the recommended E-statistics analytic methodology were presented by researchers at the Institute of Pathology and Harvard Medical School. These resources are an invaluable beginning point for the examination of single-cell perturbation data. E-distance is a universal distance metric for single-cell data that is useful in estimating the efficacy and similarity of perturbations. Researchers working with single-cell perturbation data have access to the data and software for computing E-statistics at scperturb.org, which serves as an information resource.
Introduction
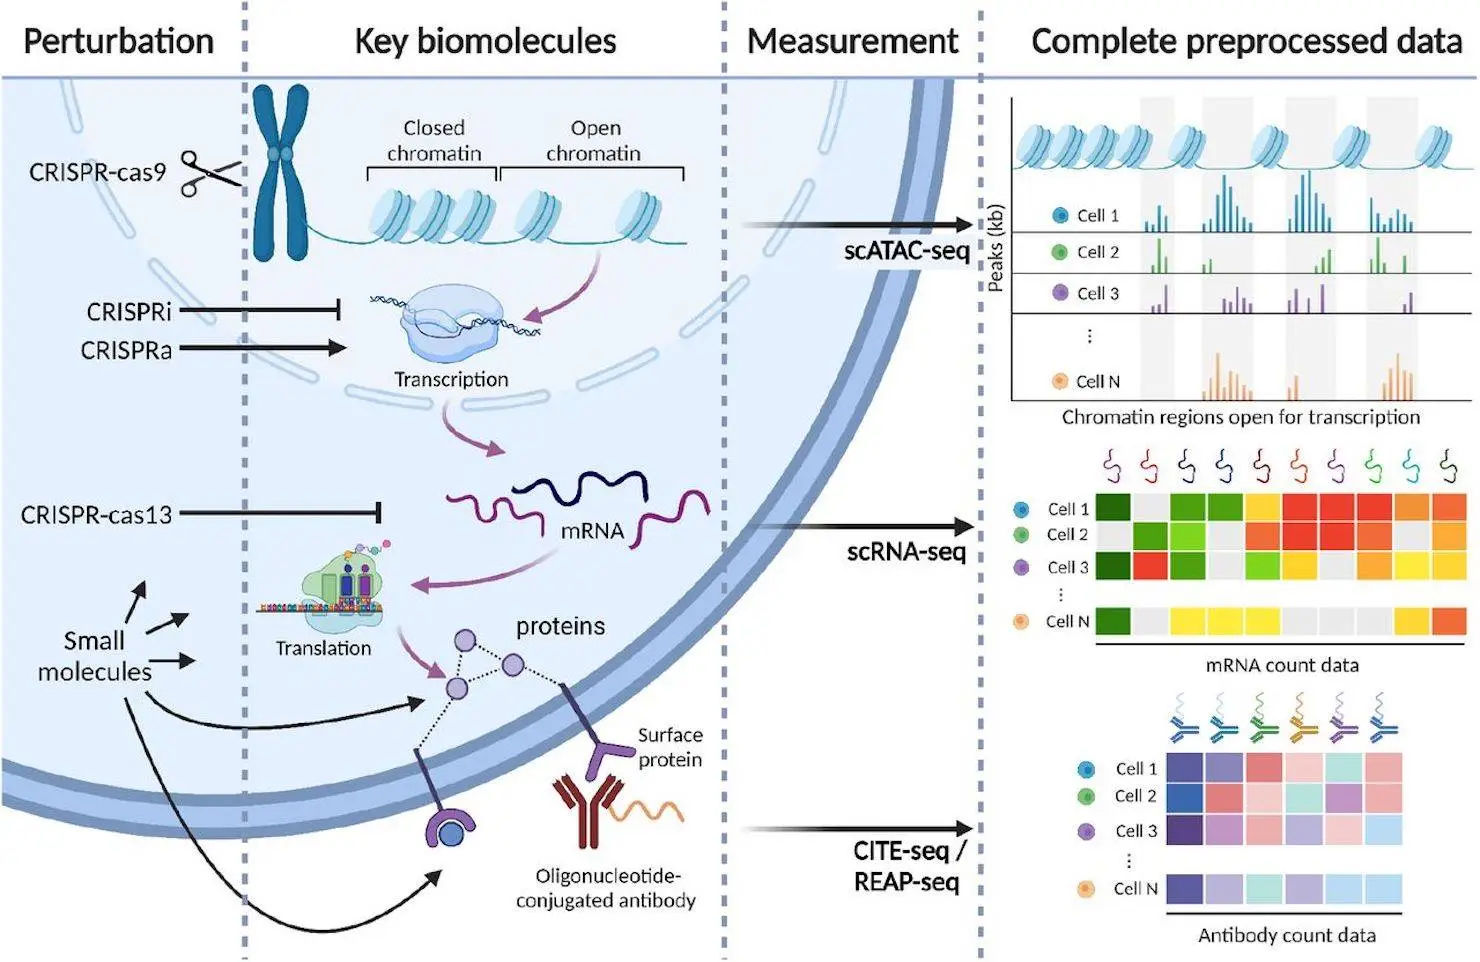
Perturbation studies are used to examine how cells react to various stimuli in cellular systems. The protein synthesis hierarchy is targeted differently by CRISPR-cas9 and CRISPR-i technologies, but CRISPR-cas13 encourages RNA degradation at the subsequent tier. Small molecule drugs have activating or inhibitory effects by directly interacting with protein products such as enzymes and receptors. These methods map chromatin accessibility, protein, transcriptome, genotype, and phenotype. Individual barcodes for each perturbed cell are read out in conjunction with scRNA-seq, CITE-seq, or scATAC-seq reads to determine the perturbation condition of each cell. Individual cells are disrupted using distinct CRISPR guides. Lately, perturbation investigations have utilized multi-omic readout sequencing, wherein CITE-seq has been used to measure surface protein counts.
Understanding complex cellular behavior through bulk observation is restricted; however, a more thorough approach can be obtained with large-scale single-cell perturbation-response screens. Investigating mechanistic processes and determining directionality in regulatory network models are made possible by these screens. To provide information on state changes, targeted perturbations might be modeled as having an impact on specific nodes within a regulatory network model. Regulating interactions, however, are frequently not well predicted by perturbation datasets because they are too tiny. Drug screens can be used to propose therapeutic interventions by analyzing the molecular effects of specific medications and creating new perturbations as dataset sizes grow.
Understanding Single-cell Perturbation
In an effort to support the development and benchmarking of computational techniques in system biology, this work offers a repository of standardized datasets describing targeted perturbations with single-cell readouts. The datasets, compiled from 25 studies, offer a comparison of experiment-specific perturbation-specific variables as well as quantification of perturbation strength. Along with describing E-distance and E-test tools for statistical comparisons of cell sets, the work benchmarks their usefulness and resilience in identifying different cell kinds and perturbations across various datasets and modalities. Scperturb.org offers a web interface for data access, analysis, and visualization.
Need for Harmonization
Statistical tools that can manage the high dimensionality of the data, cell-cell variance, and data sparsity are necessary for the study of large perturbation datasets. These factors hinder the computation of distances between perturbations. As of right now, perturbation studies lack a common statistical comparison metric. Some research loses information regarding variance within each cell type when calculating pseudo-bulk by grouping all the cells in a given perturbation. On the other hand, research involving combinations of different cell types creates intricate techniques to measure the similarity between diverse cell populations. Ideally, similar perturbations can be identified, and perturbation strength can be classified using a multivariate distance measure between groups of cells. This measure indicates how sets of cells treated with different perturbations differ or are similar, suggesting differences or similarities related to the mechanism or perturbation target. The single-cell community has investigated several scRNA-seq distance measurements, including E-distance. This test can guide the design of experiments and the selection of data for model training. It is statistically reliable for computational diagnostics of information content for a particular perturbation.
In perturbation biology, base editing is an essential computational method for producing a wide range of single-cell perturbation-response data. Numerous cell types and perturbation techniques, including knockouts, activation, interference, and prime editing, are used to generate this data. However, physiologic variations between primary tissue and cell culture, as well as batch effects, impede the large-scale integration of these datasets. Principled quantitative approaches to perturbation biology must be established, with the dataset resource acting as a basis for model construction to move from single-dataset to multi-dataset analysis.
Key Components of scPerturb
- Data Acquisition Techniques
Molecular readouts are used to analyze 44 publicly available single-cell perturbation response datasets, including proteins, transcriptomes, and epigenomes. Thirty-two CRISPR-perturbed datasets and nine drug-perturbed datasets were included in the harmonization process. Since it is hard to apply a lot of perturbations to cells, there aren’t many pharmacological datasets available. However, this mixed set of single guides for CRISPR perturbations enables large-scale scale-up. Three publications’ worth of scATAC datasets—one of which includes concomitant protein measurements—all only measure scRNA-seq. Each dataset includes mitochondrial read percentages, count matrices, gene counts, and quality control measures. Scperturb.org also has quality control plots available. Protein and RNA counts are available for download separately for three CITE-seq datasets.
2. Normalization and Quality Control
In every dataset, the number of genes per cell and UMI (Unique Molecular Identifier) counts are computed. The quantity of low-expression genes is influenced by the average sequencing depth. Even for genes with low expression, increasing sequencing depth raises the amount of UMI counts and decreases the uncertainty that comes with zero counts. The discernibility of perturbations and downstream analytic techniques may be impacted by these variations.
3. Integration and Comparative Analysis
Experimental constraints frequently place a cap on the total number of cells in each dataset; CRISPR datasets, being easier to scale up by multiplexing, tend to have more perturbations than drug datasets. Accurate data analysis depends on this trade-off between the number of perturbations and the mean number of cells per perturbation in a dataset. The signal-to-noise ratio in a dataset is indicated by the E-distance, a measurement of the spacing between cells. A significant distance suggests discrete distributions and a robust perturbation effect. A low E-distance, on the other hand, denotes a lack of a significant shift in expression patterns and may be indicative of technical problems, inefficiency, or resistance to perturbation.
The study compared the cell type associations between RNA and protein using E-distance values on a CITE-seq human PBMC dataset. All pairings of cell types’ PCA-based E-distances were calculated by the researchers, and they were then compared to perturbation E-distance. Cell-type hierarchies were computed by comparing the resultant pairwise distance matrices to established cell-type relationships. The various subtypes of B cells were grouped, with platelets standing out from the others. In the hierarchy of E-distance, lymphoid and myeloid cells were classified into two distinct groups. Because of their functional resemblance to cytotoxic T cells, NK cell clusters and innate lymphoid cells (ILCs) constituted a unique group. Distances based on protein markers were more effective in classifying immune cell types. The study concluded that protein representations more accurately represent cell type differences, while RNA representations primarily reflect functional programs of cells like cytotoxicity or proliferation. In both cases, E-distance accurately captures the known characteristics of each measurement modality.
Outcome of the Study
A thorough approach to measuring and examining datasets with single-cell perturbations is offered by the dataset resource. For data integration, benchmarking, and investigating common perturbations across datasets, the resource provides consistent annotations. By using E-distance, perturbations within each dataset may be quantitatively compared to find which perturbations are functionally similar and which are dissimilar. Additionally, the resource looks at how dataset-specific characteristics affect E-statistics and demonstrates that E-statistics stabilize at counts greater than 1000 per cell and at 300 per perturbation.
Conclusion
Researchers hope that the E-statistics analytical framework and the scPerturb dataset collection will be a useful place to start for examining single-cell perturbation data. To train models on this data, the machine learning community can make use of perturbation significance testing and uniform annotations. The community will be able to create innovative computational techniques with the goal of creating precise and quantitatively predictive models of cell biological processes and designing focused treatments for research or therapeutic use thanks to future datasets and experimental perturbation techniques.
Article Source: Reference Paper |scPerturb open access source code is available at GitHub. A corresponding Python package for performing E-statistics (E-distance and E-testing) in single-cell data is published on PyPI.
Follow Us!
Learn More:
Deotima is a consulting scientific content writing intern at CBIRT. Currently she's pursuing Master's in Bioinformatics at Maulana Abul Kalam Azad University of Technology. As an emerging scientific writer, she is eager to apply her expertise in making intricate scientific concepts comprehensible to individuals from diverse backgrounds. Deotima harbors a particular passion for Structural Bioinformatics and Molecular Dynamics.


