
Single-cell RNA sequencing (scRNA-seq) has brought a revolution in biological research by granting scientists a look into the mechanisms inside individual cells within a population. It is an incredible technology that is also challenging due to the huge amount of data generated. One critical aspect of scRNA-seq analysis involves comparing cell type proportions across conditions. At this juncture, LotOfCells comes into play.
LotOfCells is an R package developed by Óscar González-Velasco from Straße, Germany, which offers a solid statistical framework for investigating cell type proportions in scRNA-seq data to deliver more accurate visualizations. In particular, it addresses a major challenge in scRNA-seq analysis; it identifies significant differences between the abundance of different cell types amongst different experimental groups.
How LotOfCells Works
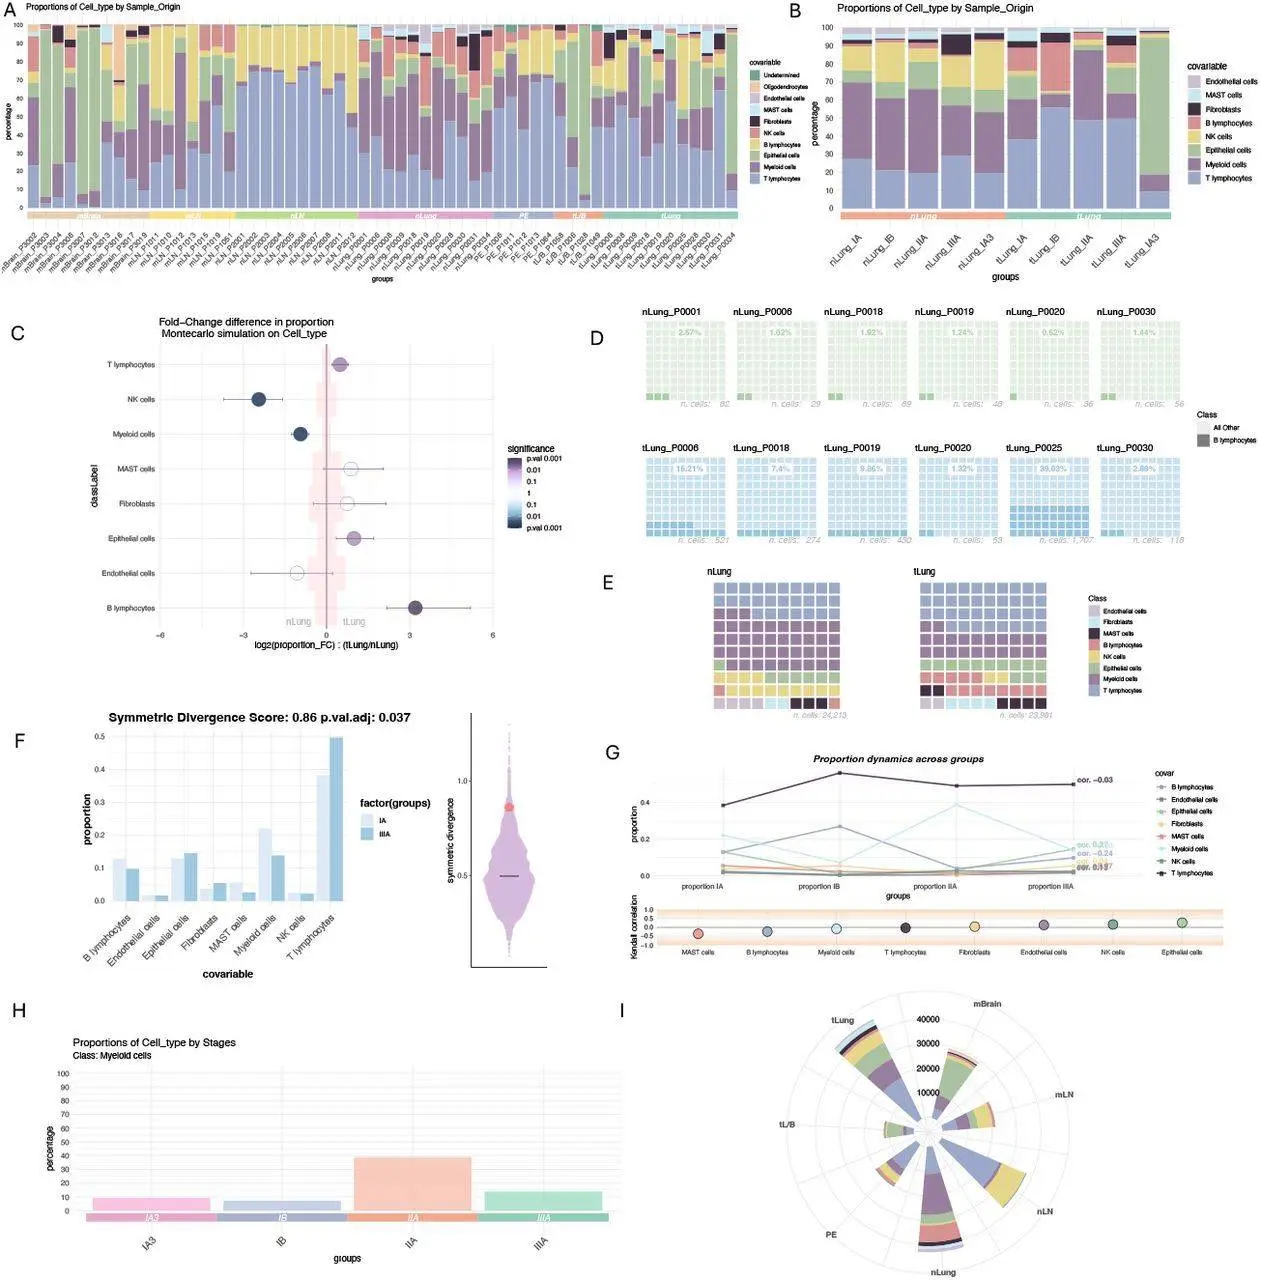
LotOfCells has a smart feature referred to as Monte Carlo simulations that underlies the evaluation of these differences.
Here’s a step-by-step breakdown:
- Stage Setting: Here, you will define your cell types (referred to in LotOfCells’ parlance as “classes”) and conditions you wish to compare (e.g., healthy vs diseased tissue)
- Reality Simulations: After highlighting some differences between bootstrapping as used by LotOfCells, it goes on to explain how lotofcells does this. This involves randomly drawing cells from each group, thus modeling how cell numbers can vary in real life. It randomly selects several virtual cells from each group several times; therefore, each situation gets numerous samples.
- Percentage Calculations: LotOfCells calculates new proportions for each cell type found in the simulation based on a random sampling of cells across different scenarios. LotOfCells thus provides us with expectations about what would happen if there were genuinely no differences at all between groups concerning their proportions.
- Sifting Through the Noise: The heart of the analysis lies in comparing the actual observed differences in cell type proportions between your conditions to the null distribution generated by the simulations. If this difference does not fall within the range of what is expected by chance during simulations, we call it statistically significant. This gives strong evidence that there exists an actual difference between the compared groups.
Beyond Two Groups
LotOfCells is not limited to two categories only but can be extended to situations where several ordered conditions are available, such as stages of disease progression. In these instances, LotOfCells uses Kendall’s Tau-a correlation, which is a statistical test that determines if changes in cell type proportions are associated with the order of conditions. By doing this, researchers will be able to understand how cell populations evolve across various experimental states and identify trends.
Addressing Zero Counts: A Common Hurdle in scRNA-seq Analysis
When studying scRNA-seq, some samples may have no cell types (zero counts) at all. So LotOfCells takes care of this matter by including a pseudo-count strategy based on the hyperbolic arcsine function. This mathematical trick will make it possible for the statistician to work accurately and efficiently without any division by zero errors.
Measuring Overall Dissimilarity: The Symmetric Divergence Score
While differential analysis focuses on individual cell types, LotOfCells offers another important feature – the Symmetric Divergence Score. This score gives one number to measure the different distribution of cell types in two samples. It uses Kullback-Leibler (KL) divergence, which measures how much the two probability distributions differ. Taking both ways divergence (sample 1 versus sample 2 and vice versa), the Symmetric Divergence Score reflects a total situation of dissimilarity between cell populations. As in differential analysis, LotOfCells determines the statistical significance of this metric through permutation analysis.
Unveiling the Cellular Landscape: Visualization with LotOfCells
LotOfCell’s visualization is also very informative, not just a statistical method. It can be linked up with other R packages like ggplot2, enabling scientists to make nice plots that can show percentages of cell types and their changing patterns under different conditions. These visualizations enhance the understanding of biological insights while communicating research discoveries.
Beyond the Code
The accessibility of LotOfCells is not only dependent on its algorithms but also on its coding. The complete collection of all codes used in creating this software, supplementary examples, and a user guide that covers everything you need to know are freely available on GitHub. Through this way of sharing information, we encourage collective scientific effort and enable researchers to utilize the full capacity of their LotOfCells in their studies.
Join the Conversation
The LotOfCells represents a major leap forward in scRNA-seq data analysis and interpretation. It allows researchers to better understand complex cellular populations by giving them strong statistical methods and informative visualization. LotOfCells remains a valuable resource for revealing the hidden secrets about individual cells as single-cell biology progresses.
Have you had experience analyzing scRNA-seq data? What challenges have you faced? How do you see LotOfCells impacting the field of single-cell biology?
Add your comments below – let’s chat!
Article Source: Reference Paper | LotOfCells R package, manual, and relevant examples can be accessed at GitHub.
Important Note: bioRxiv releases preprints that have not yet undergone peer review. As a result, it is important to note that these papers should not be considered conclusive evidence, nor should they be used to direct clinical practice or influence health-related behavior. It is also important to understand that the information presented in these papers is not yet considered established or confirmed.
Follow Us!
Learn More:


Anchal is a consulting scientific writing intern at CBIRT with a passion for bioinformatics and its miracles. She is pursuing an MTech in Bioinformatics from Delhi Technological University, Delhi. Through engaging prose, she invites readers to explore the captivating world of bioinformatics, showcasing its groundbreaking contributions to understanding the mysteries of life. Besides science, she enjoys reading and painting.


