Integrating metabolomics with other omics and providing insights into the biology of disease requires bioinformatics competence. Integration is difficult with present approaches, though, as they frequently call for programming knowledge. Unidentified metabolites are difficult for current methods to handle, and they leave out a sizable amount of data from untargeted metabolomics studies. Here, researchers from the Children’s Mercy Research Institute, Kansas City, introduced iModMix, a novel method for building network modules for multi-omics data integration and analysis that use a graphical lasso. Through the use of a horizontal integration approach, iModMix enables the analysis of metabolomics data in conjunction with proteomics or transcriptomics to investigate intricate molecular relationships inside biological systems. Crucially, it can take into account both recognized and unidentified metabolites, which solves a major drawback of current approaches. The R Shiny application iModMix is easy to use and doesn’t require any programming knowledge. It comes with sample data from other publically accessible multi-omic studies for investigation. Advanced users have access to an R package.
Introduction
Metabolomics and other omics modalities are crucial for a comprehensive understanding of disease mechanisms and biological systems. However, there are obstacles to overcome to successfully integrate different modalities, including adjusting to various experimental configurations and data types and integrating unknown metabolites. Due to the irregular use of standard identifiers and naming mismatches, current methods frequently limit the inclusion of metabolite identifications. As a result, certain detected metabolites are excluded, which further restricts and impedes thorough insights. Consequently, the integration of different modalities is necessary for a more thorough knowledge of disease mechanisms.
Metabolomics integration methods can generally be divided into two categories: vertical integration and horizontal integration. Vertical integration is the process of merging several omics datasets into a single output, like a merged dataset or clustering assignments. An example of vertical integration is iClusterPlus, which clusters samples in latent space and extracts latent variables across datasets. In contrast, horizontal integration preserves the original input context while using several omics datasets concurrently. One example of horizontal integration is PIUmet, which creates a network output with both proteins and metabolites by merging proteome and metabolomics data.
Understanding iModMix
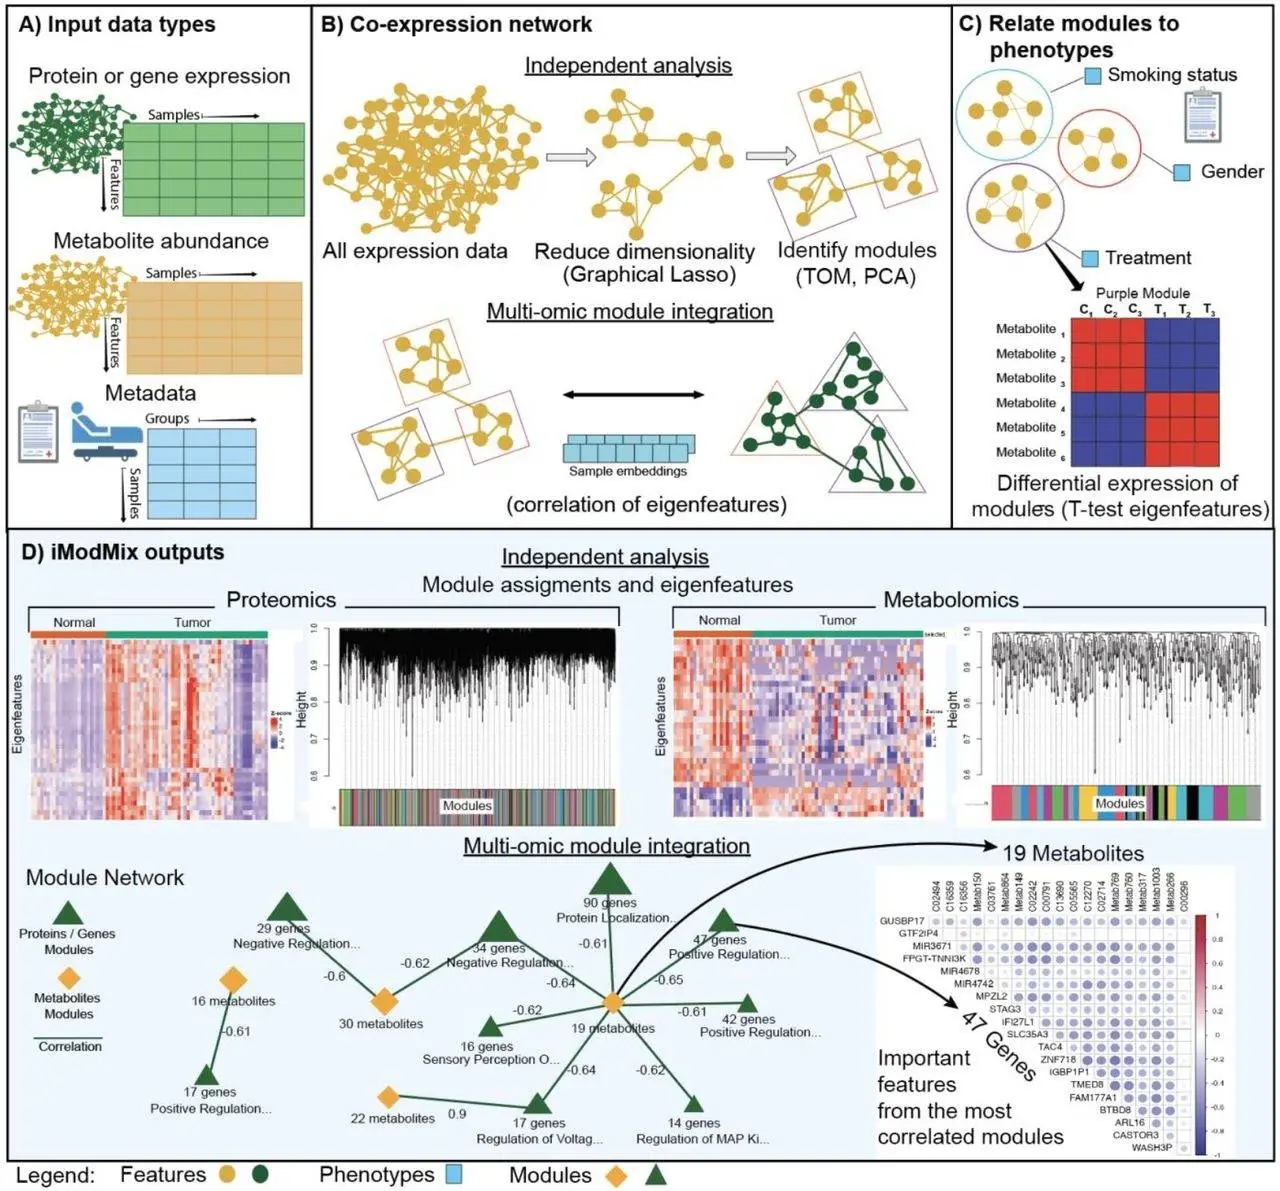
iModMix is a platform for horizontal integration that uses two input omics datasets, including proteomics and metabolomics, to build network modules. For every input dataset, it estimates a sparse Gaussian Graphical Model (GGM) using a graphical lasso, identifying direct relationships between the datasets. The calculation of a Topological Overlap Matrix (TOM), which measures how much a pair of features share neighbors, is similar to WGCNA. Using TOM dissimilarity, hierarchical clustering is used to organize related features into modules. An eigenfeature, which represents the contents of the module, is the first main component of the abundance of features in the module. Tests of differential expression or correlation with experimental circumstances can be conducted using these eigenfeatures. Eigenfeatures from several studies are correlated to facilitate integration amongst omics types.
The ability to generate network modules and related eigenfeatures without depending on pre-existing pathway databases like KEGG is one of iModMix’s key advantages in feature annotation. With its user-friendly graphical interface and comprehensive documentation, this approach can reveal novel relationships between features and is offered as an R Shiny application. It can finish analysis in less than an hour for typical data sizes of 20,000 variables and can be used on normal desktop PCs with a multi-core processor and at least 8GB of RAM.
Methodology
Two omics datasets can be fed into the iModMix workflow at once, and users can annotate each one at the feature level to match the input omics dataset. To perform PCA, heatmaps, and boxplots, a distinct metadata file with sample IDs and at least one sample grouping column must be present. Each feature is centered on having a mean of zero and a standard deviation of one to scale the data. Users have the option of providing their own imputed data or utilizing the k-nearest neighbors algorithm to impute missing variables. iModMix offers ten datasets, labeled “Feature_ID” and “Samples,” that contain gene expression and metabolomics data to help users interact with the tool and show how it can handle unknown compounds.
The glassoFast R package is used by iModMix to estimate GGM, calculate TOM, and apply TOM dissimilarity for hierarchical clustering. Modules are developed using the ‘hybrid’ approach, and assignments are refined according to branch form. The WGCNA R package’s moduleEigengenes function determines the eigenfeatures for every module, allowing for the use of the function in subsequent omics analysis.
Multi-omics analysis by iModMix
iModMix uses the Spearman correlation between eigenfeatures to integrate modules across omics datasets. By depicting metabolite modules as yellow diamonds and protein/gene modules as green triangles, it builds an interactive network. To view and investigate in-depth correlations within these modules, users can choose how many of the top multi-omics module correlations to display. The program offers lists of metabolites and proteins/genes within highly connected modules to facilitate additional pathway analysis and phenotypic classification.
Conclusion
Transcriptomics, proteomics, metabolomics, and clinical data are all integrated using the omics program iModMix to provide a full understanding of biological systems. Each dataset is subjected to independent studies to discover physiologically relevant modules, which are then integrated through the correlation of eigenfeatures. iModMix visualizes the network interaction and the most connected modules while assessing relationships between phenotype-related modules across various data formats. Interactions that are not visible by metabolomics or transcriptomics alone are captured by the iModMix methodology. With features including de novo network construction, independence from pre-existing pathway databases, and the capacity to combine annotated and unidentified metabolites for multi-omic analysis, iModMix advances the area of multi-omic analysis.
Article Source: Reference Paper | iModMix is available as a user-friendly R Shiny application at Link | An R package is available for advanced users is available on GitHub.
Disclaimer:
The research discussed in this article was conducted and published by the authors of the referenced paper. CBIRT has no involvement in the research itself. This article is intended solely to raise awareness about recent developments and does not claim authorship or endorsement of the research.
Important Note: bioRxiv releases preprints that have not yet undergone peer review. As a result, it is important to note that these papers should not be considered conclusive evidence, nor should they be used to direct clinical practice or influence health-related behavior. It is also important to understand that the information presented in these papers is not yet considered established or confirmed.
Follow Us!
Learn More:
Deotima is a consulting scientific content writing intern at CBIRT. Currently she's pursuing Master's in Bioinformatics at Maulana Abul Kalam Azad University of Technology. As an emerging scientific writer, she is eager to apply her expertise in making intricate scientific concepts comprehensible to individuals from diverse backgrounds. Deotima harbors a particular passion for Structural Bioinformatics and Molecular Dynamics.

