There is no one-size-fits-all approach to differential expression analysis, and the best method for a given dataset depends on the specific research question. Various cell type-specific methods are available, and it is important to choose the method that is appropriate for the data. Nine methods that analyze cell type-specific differential gene expression (csDEG) were compared through rigorous evaluation methods on both simulated and experimental datasets. The results could guide researchers who wish to adopt csDEG analysis in use and the limitations of the current methods.
It has been a long-standing concept that the initiation and progression of diseases are not just the work of autonomous cells but a joint partnership with their immediate environment, the microenvironment. When, in 1863, Robert Virchow observed the infiltrating leukocytes, thus recognizing the influence of inflammation in cancers, the importance of understanding the complex multicellular interactions with the microenvironment that mitigate the diseased states were revealed. One technique that is widely used to study this is gene expression studies that identify aberrant gene expressions within the diseased tissues.
Bulk RNA-Seq dissects the genetic makeup of a population of cells within the sample. The differentially expressed gene (DEG) analysis of data acquired through it helps to compare the gene expression patterns between different tissue states, such as normal and diseased, to identify key genes driving the diseases. But a downside of this is that the measured DEGs could be due to actual differences in gene expression and/or differential cell composition caused by the altered microenvironment.
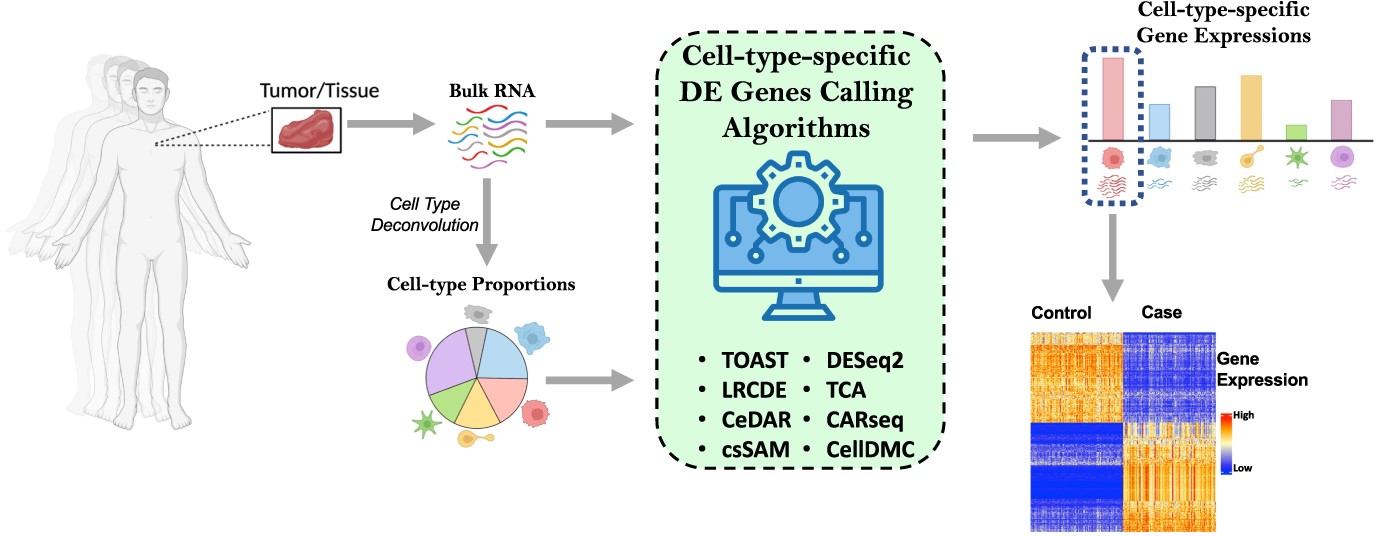
To tackle the obstacle of tissue heterogeneity in DEG analysis, cell type-specific differentially expressed gene (csDEG) analysis methods were developed. csDEG analysis studies differential expression by taking into account the composition and proportion of cell types within a sample. Today, there are several of these methods based on different algorithms leading to the common question, Which should I use? Understanding this dilemma, Scientists at the Case Western Reserve University, in collaboration with the University of Texas, reviewed some of the most commonly used methods for csDEG analysis addressing issues of sensitiveness and parameter choices by studying the performance of these methods on simulated and experimental datasets.
The study assesses the performance of nine methods: CARseq, TOAST, CeDAR, CellDMC, LRCDE, TCA, csSAM, HIRE, and DESeq2, all of which are available as R packages. Cellular deconvolution estimates the cell-type composition within the sample, which is then used as the input for the csDEG analysis along with RNA-Seq data. The dataset to test the performance was simulated by using gene profiles of six pure immune cells from whole blood samples (GSE60424) and mimicking the cell type proportions from 16 real single-cell RNA-Seq data.
Performance Evaluation
The main evaluation criteria used in the study is the True Discovery Rate (TDR) which is the percentage of true csDEG predicted among the most significant genes. The performance of all nine methods was assessed under different scenarios to determine the limitations of the methods and to identify those that performs the best:
- Baseline Simulation: It was performed with a sample size of 100 for both case and control groups and with 30,000 genes across the cell types. The aggregate results from the six cell types showed TOAST, CellDMC, TCA, and CARseq to have better performance, while DESeq2 and csSAM showed the poorest performance.
- Sample and Effect Size: Sample size – Simulations with 20, 50, 70, 100, and 200 sample sizes for each group were performed in all possible combinations of case and control groups. It was observed that though increasing the sample size had only a moderate impact on TDR it could vastly improve the statistical power. Effect size: It is concerned with the log-fold change (LFC) and hence the degree of differential expression between the two groups. Simulations with 0.5, 1, 2, 3 and 4 LFCs were obtained by tinkering with the baseline gene expression. A dramatic increase in TDR with increased effect size was observed, though, on the flip side, the existing methods showed lower TDR with low effective sizes (LFC = 0.5). TOAST, CellDMC, TCA and CARseq still performed the best in the current analysis.
- Gene expression ranges and library sizes: Genes were stratified based on the expression levels into nine strata. It was observed that for all the methods, the sensitivity increased with increased expression levels. Genes with low baseline expression values < 20 were observed to have poor sensitivity even with high effect sizes (LFC = 2).
- Cell Type proportions: Simulations with cell proportions between 5%, 15%, 30% and 60% were designed to study the impact of nearly negligible to dominant cell type counts. A positive correlation with precision was observed for genes having high baseline expressions. In genes with low expression, though, increased cell proportions don’t seem to induce much improvement.
- LFC variance: The impact of the alterations in gene expression values was simulated by varying standard deviations of LFCs from 0.2 to 1. As the heterogeneity and variance of LFC increased, the precision of the csDEG analysis seems to reduce, with LRCDE being the most affected.
- Running Time: 20 simulations are conducted to determine the running time of each method. TOAST was determined to be the fastest, with CARSeq, which employs an iterative algorithm, being the slowest.
In the last session of this study, the authors employed all nine methods on real datasets of irritable bowel disease, autism spectrum disorder, and lung adenocarcinoma. The study identified gene pathways on par with previously published literature and also inferred additional insights. It found TOAST and CellDMC to be more conservative, i.e., a higher number of consensus csDEGs with the other methods and hence possibly more accurate results. DESeq2 and csSAM were more liberal, identifying more csDEGs that are not overlapping with other methods and could hint at an inflated number of false positives.
Conclusions
Though the concept of csDEGs is revolutionary, the current analysis methods face certain limitations, some of which are addressed through this study. All nine methods showed reduced precision with low effect sizes, though a higher sequencing depth can alleviate a part of the problem. Currently, available methods are insensitive to genes with low expression values, irrespective of their effect sizes. Furthermore, no method is yet equipped to study repeated sample measures within each subject. Even amidst having room for improvement, csDEG analysis produced valid results in the assessment of real RNA-Seq data proving the resourcefulness of the present methods.
Article Source: – Reference Paper
Learn More:
Top Bioinformatics Books ↗
Learn more to get deeper insights into the field of bioinformatics.
Top Free Online Bioinformatics Courses ↗
Freely available courses to learn each and every aspect of bioinformatics.
Latest Bioinformatics Breakthroughs ↗
Stay updated with the latest discoveries in the field of bioinformatics.
Catherene Tomy is a consulting Content Writing Intern at the Centre of Bioinformatics Research and Technology (CBIRT). She has a master’s degree in Molecular Medicine from Amrita University with research experience in the fields of bioinformatics, cell biology, and molecular biology. She loves to pull apart complex concepts and weave a story around them.
.
