When analyzing omics data, regression analysis is an essential tool for identifying biomarkers. For the analysis of graph-structured data, graph neural networks (GNNs) are the most popular deep learning model. Their ability to consistently identify biomarkers across several datasets and their prediction accuracy is, nevertheless, limited. These difficulties arise from the distinct graph structure of biological signaling networks, which have many targets and intricate relationships. Researchers from Washington University developed a novel GNN model architecture called PathFormer in this study to address these issues. PathFormer ranks biomarkers and predicts disease diagnosis by methodically integrating signaling networks, prior knowledge, and omics data. In comparison results, PathFormer performed better than GNN models, showing a 30% increase in illness diagnostic accuracy and strong repeatability of biomarker ranking across several datasets. With two separate transcriptome datasets for cancer and Alzheimer’s disease, this improvement was verified, indicating that PathFormer is a useful tool for other omics data processing investigations.
Introduction
Large-scale and customized omics datasets have been created as a result of the development of next-generation sequencing (NGS) and high-throughput technologies. These datasets have been utilized to find new targets linked to disease. For the majority of diseases, however, the intricate and enigmatic disease cause is still unknown. Using techniques like fold change and regression analysis, biomarker or target identification is essential for accurate disease diagnosis and comprehending disease pathophysiology in omics data analysis. These methods, however, are unable to simulate the signaling relationships between distinct targets or proteins. By identifying stable network module biomarkers or hub genes, network-based analysis, which makes use of signaling networks and protein-protein interactions (PPIs), can aid in understanding the contributions of gene sets of pathways to disease phenotypes.
Understanding GNN
Graph neural networks, or GNNs, are the most widely used architecture for modeling graph-structured data. They have demonstrated remarkable performance on a variety of graphs, such as social networks, molecules, and circuits, in analysis tasks. On the other hand, existing GNNs perform poorly in phenotypic prediction; in tasks involving the categorization of Alzheimer’s disease, their classification accuracies are nearly 0.6. This indicates low diagnosis accuracy, as it is marginally better than wild guesses. Furthermore, the data produced by present GNNs are not interpretable or biologically meaningful.
Gene set enrichment analysis (GSEA) is a useful tool for biological pathway and process identification. It works by removing selected gene subsets from the input gene network. SortPool and GAT, two GNN architectures, offer methods for rating nodes’ contributions to choose the gene subset; however, both approaches are not robust or disease-specific, leading to target ranking that is not fully reproducible. Consequently, even if GNNs have demonstrated promise in modeling graph-structured data, there is still a limit to their potential in practical bioinformatics applications.
The difficulties are believed to originate from the distinct graph structure of biological signaling pathways, which include numerous targets and intricate and intense signaling connections between these targets. The limits of current GNNs in gene network representation learning were described theoretically. More specifically, gene networks typically have hundreds of genes/nodes, many of which have extraordinarily high node centralities, in contrast to graphs in the well-known benchmark graph datasets. These characteristics account for two elements of the poor prediction performance of dominating GNNs: When applied to large-scale graphs like gene networks, dominant expressive GNNs such as subgraph-based GNNs and high-order GNNs—have the space/time complexity problem. (1) Dominant GNNs suffer from the over-squashing problem for graphs with large average node degree/centrality. Therefore, new GNN models are required for the analysis of signaling network-based omics data for the purpose of detecting biomarkers and diagnosing diseases.
Looking into PathFormer
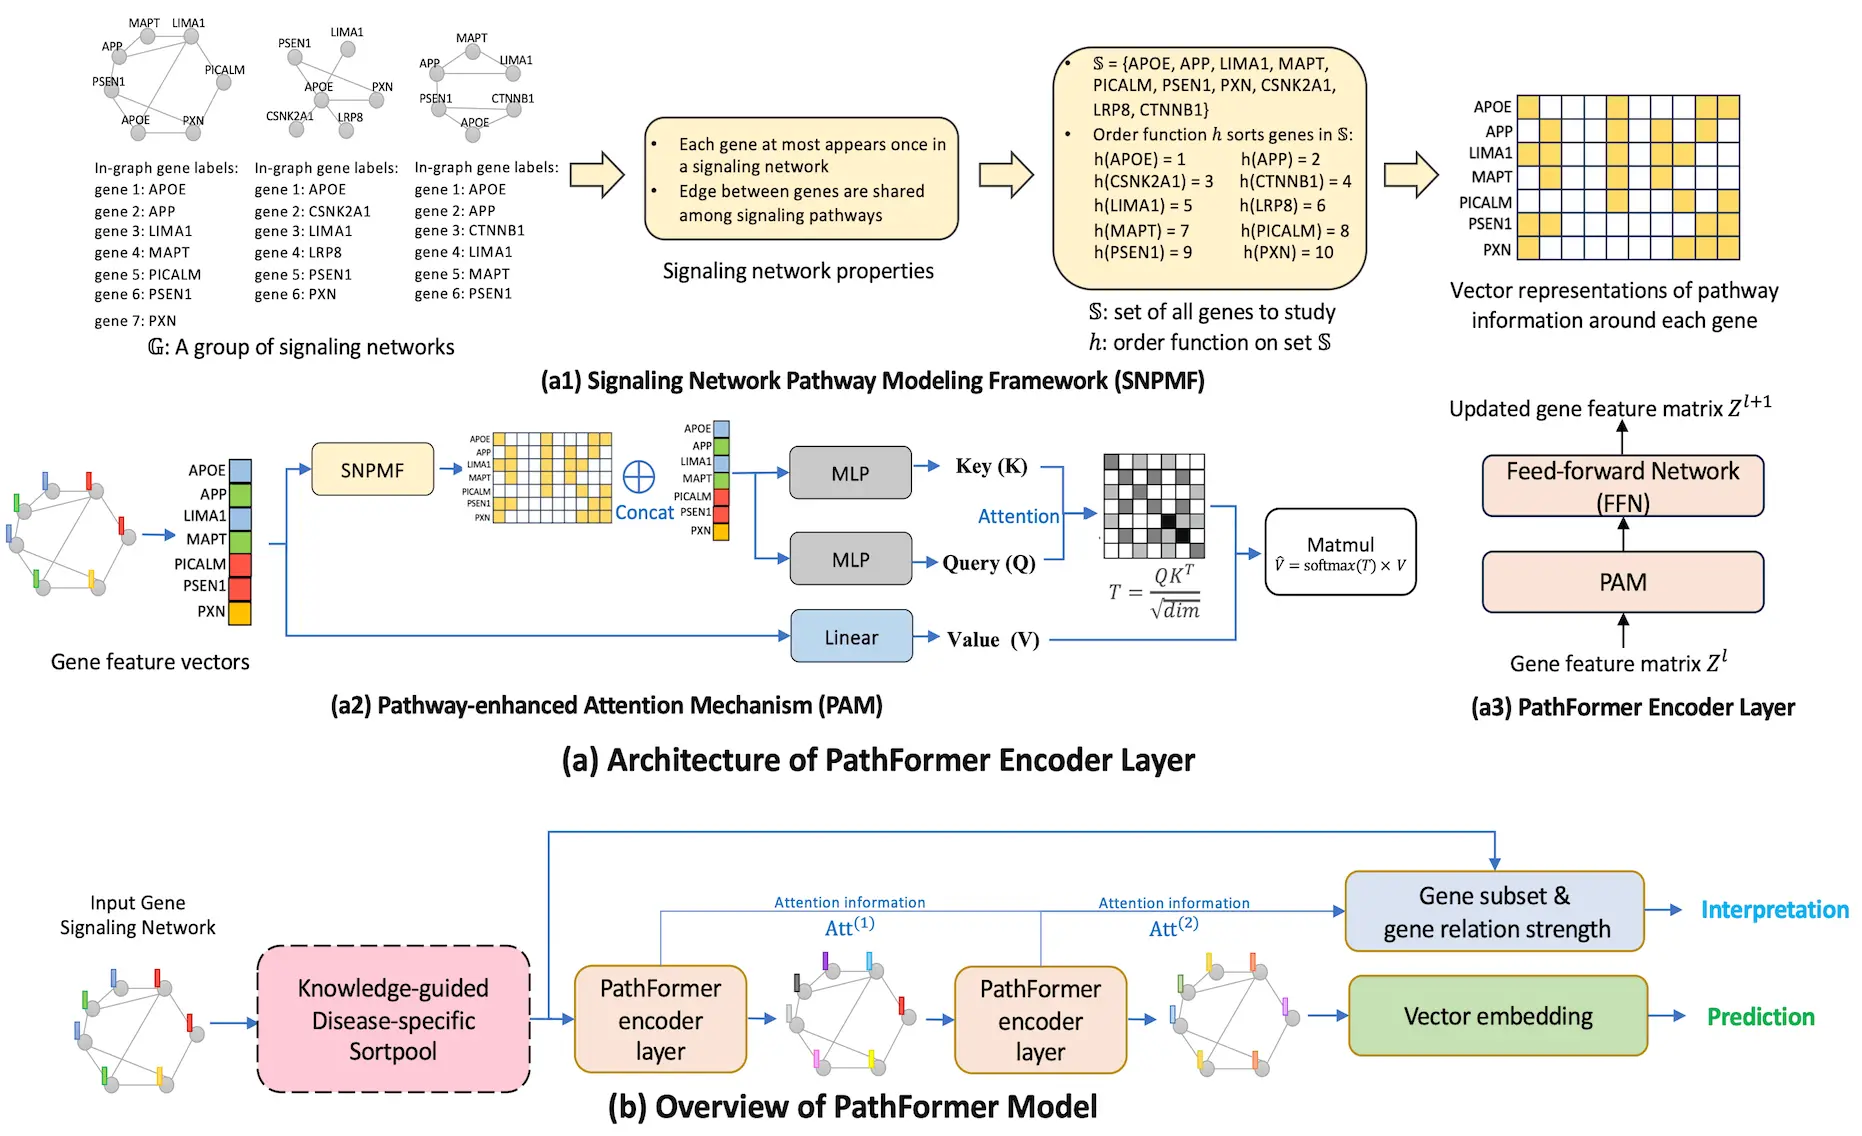
A strong GNN is suggested in this research for gene-network-based bioinformatics applications, namely for accurate prediction and reliable gene subset detection. The Transformer design, which collects data via the self-attention mechanism, provides the foundation for the new PathFormer encoder layer, a graph convolution architecture. The expressive power of the method is maximized to improve prediction performance without causing complexity problems. In order to provide flexibility in capturing the pathway relation between any pair of genes in a gene network, the PathFormer encoder layer injects gene pathway information as a learnable attention bias matrix to the attention mechanism. Graphs’ pathway information is ignored by the Transformer architecture, which is intended for sequence data.
Introducing KD-Sortpool
The ability of deep learning models to produce correct predictions is essential for practical bioinformatics when interpretability is concerned. Through the use of a Knowledge-guided Disease-specific Sortpool layer (KD-Sortpool), this paper seeks to identify the gene subset that can interpret biological knowledge particular to a given disease. In order to retain the top K genes, KD-Sortpool sorts the genes in the input gene network based on a metric value V using a sort-and-pool technique. Quantitative measurements, such as the DisGeNET GDA score, are used to characterize the gene-disease relationship. Both the cancer and Alzheimer’s disease (AD) classification tasks are difficult bioinformatics tasks that are used to evaluate the PathFormer model. On average, the PathFormer model outperforms current AI models on Alzheimer’s disease (AD) datasets by at least 38% and on cancer datasets by 23%, according to experimental results. Also, a stable gene set particular to a disease is identified via the PathFormer model.
Conclusion
This paper examines the differences in average node degrees and graph sizes between gene networks and prominent graph datasets, including ZINC, D&D, MUTAG, BN, NA, and molhiv. Most common graph benchmarks take small-scale graphs into account; however, gene networks are large-scale graphs with more than 3000 genes. Gene network over-squashing occurs when the node receptive field rises exponentially with the number of GNN layers, a phenomenon caused by large node degrees. Dominant GNNs compile an excessive amount of data into a single vector, which might be a bottleneck. Moreover, the expressivity of common GNNs to encode all graph information is limited, which has resulted in the creation of high-order, subgraph-based GNNs with a minimum complexity of 𝑂(𝑛2), where 𝑛 is the graph size. When applied to large-scale graphs such as gene networks, these sophisticated deep learning models, which improve prediction performance, could encounter space/time complexity problems. Well-known GNNs are effective low-pass filters on graphs, removing high-frequency components from node characteristics. Both high-frequency and low-frequency components are crucial in gene networks, though. Because they lack the low-path nature of gene networks, popular GNNs that remove high-frequency components are, therefore, inappropriate for use in gene networks.
Article source: Reference Paper
Important Note: bioRxiv releases preprints that have not yet undergone peer review. As a result, it is important to note that these papers should not be considered conclusive evidence, nor should they be used to direct clinical practice or influence health-related behavior. It is also important to understand that the information presented in these papers is not yet considered established or confirmed.
Follow Us!
Learn More:
Deotima is a consulting scientific content writing intern at CBIRT. Currently she's pursuing Master's in Bioinformatics at Maulana Abul Kalam Azad University of Technology. As an emerging scientific writer, she is eager to apply her expertise in making intricate scientific concepts comprehensible to individuals from diverse backgrounds. Deotima harbors a particular passion for Structural Bioinformatics and Molecular Dynamics.

