
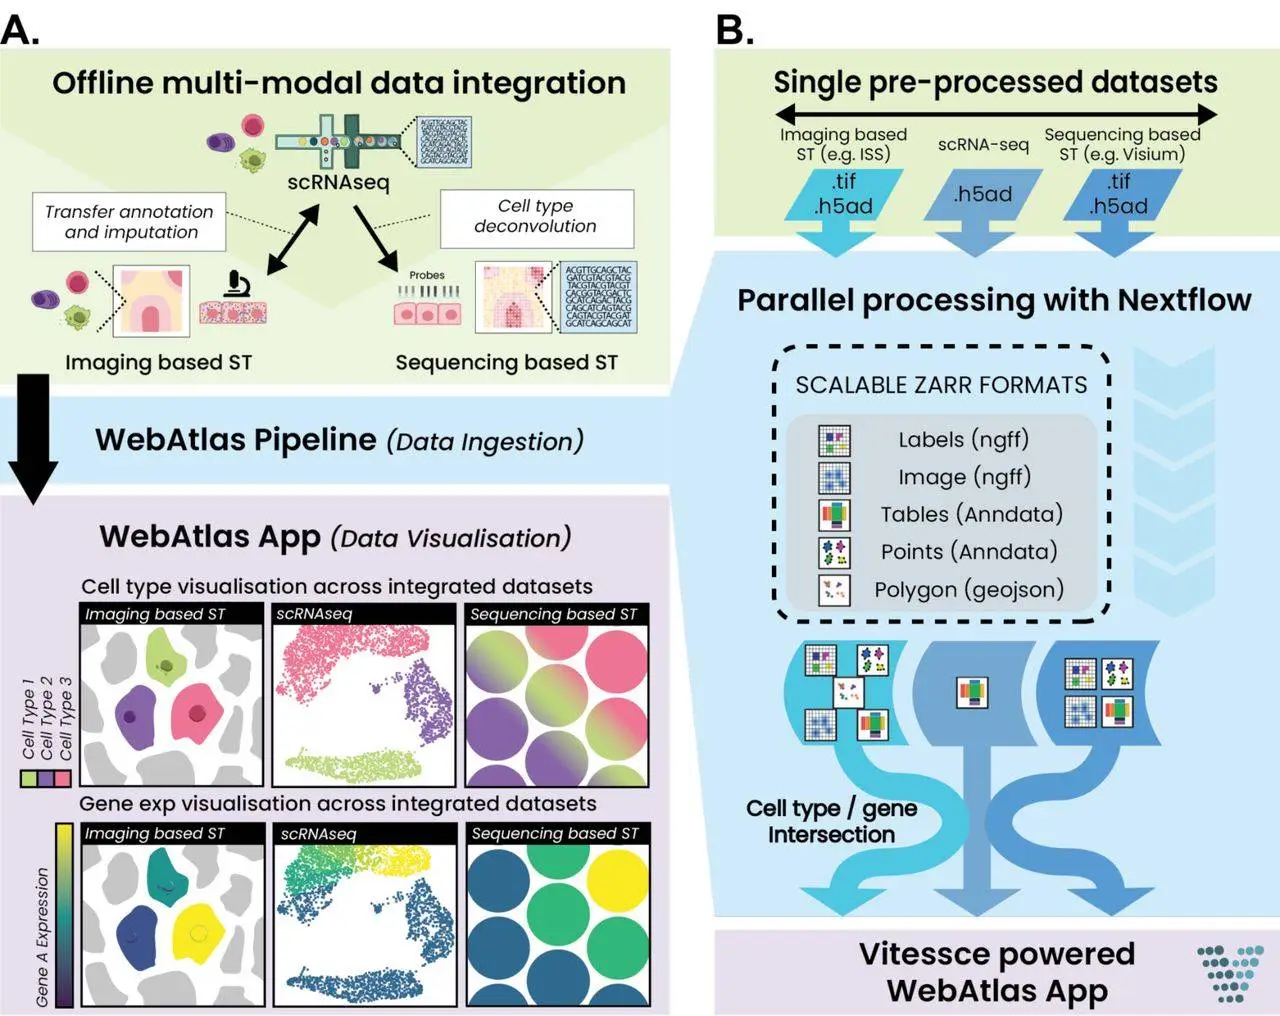
A recent study by Tong Li and colleagues from the Wellcome Sanger Institute and other institutions introduces WebAtlas, an innovative pipeline aimed at addressing such challenges. WebAtlas provides a friendly interactive environment for sharing and discovering unified datasets of single-cell and spatial transcriptomics. To understand the complexity of tissues and organs, the world of biological research has found single cell & spatial transcriptomics to be highly valuable. On the one hand, scRNA-sequencing (scRNA-seq) reveals individual cells’ gene expression profiles, while on the other hand, spatial transcriptomics highlights their presence inside a tissue. However, the integration of these two types of data is challenging due to differences in size and nature.
Understanding WebAtlas
WebAtlas is a very powerful tool for conducting integrated single-cell and spatial transcriptomic data analysis. It has some unique features that make it a handy tool for researchers.
Key Features of WebAtlas:
Data Ingestion and Conversion
- Various Data Formats: WebAtlas works with multiple formats of single-cell, spatial transcriptomic data such as scRNA-seq, Visium, Slide-Seq, and In Situ Sequencing (ISS), among others.
- Conversion to Zarr Format: The pipeline quickly changes diverse sets of evidence into the Zarr format, which is useful in cloud storage and analysis, thus making it easier to integrate and understand the data.
Data Integration
- Computational Integration: WebAtlas provides computational integration of single-cell and spatial data, linking cell types and gene expression patterns across different modalities, thereby helping to get a fuller picture of cellular behavior and tissue organization.
Interactive Visualization
- Vitessce Framework: The pipeline exploits the Vitessce framework to deliver a friendly web-based user interface for exploring integrated datasets.
- Cross-Querying: Users can easily cross-query cell types and genes through different modalities that would otherwise help them understand the relationships amongst them and how they are distributed in space.
- Visualization Tools: There are various visualization tools found in WebAtlas, which include heat maps, scatter plots, and spatial maps that facilitate researchers’ effective visualization and interpretation of data.
Scalability
- Large Dataset Handling: WebAtlas was designed to handle large-scale datasets, and thus, it can be applied to analyze complex biological systems. Pipelines can efficiently process and visualize datasets with millions of cells or RNA molecules.
User-Friendly Interface
- Intuitive Navigation: The web-based interface is intuitive and easy to navigate even for researchers who have limited computational experience.
- Customizable Settings: Users may customize diverse settings like visualization parameters and data filtering alternatives to conform to the research analysis needs at any given time.
Cloud-Based Platform
- Accessibility: This cloud-based platform provides an ease of access to scientists worldwide who may benefit from it.
- Scalability: Researchers can handle large-scale analyses without any limits using the cloud infrastructure that gives room for scalable computing resources.
Data Sharing and Collaboration
- Shareable Outputs: WebAtlas generates shareable outputs, including interactive visualizations and data exports, making it easier for research findings to be disseminated and collaborations to be formed.
The integration of these key components makes WebAtlas a flexible and powerful utility for researchers engaged in integrated single-cell and spatial transcriptomic studies, simplifying the process of data analysis, providing deeper insights into biological mechanisms, and promoting scientific collaboration.
A Case Study: The Developing Human Lower Limb
Developing a human lower limb multi-modal atlas was utilized as a case example to show how WebAtlas operates. By combining scRNA-seq with Visium and ISS information, this atlas creates a comprehensive dataset for studying the cellular dynamics and spatial organization during limb development.
WebAtlas made it possible for scientists to:
- Cross-querying cell types and genes between different modalities.
- Comparing spatial cell type distributions between Visium and ISS datasets.
- Identifying spatially variable gene expression patterns within particular cell types.
- Exploring the proximo-distal gradient of chondrogenesis within the developing limb.
Conclusion
WebAtlas is a paramount leap in the realms of single-cell and spatial transcriptomics. This tool comprises an easy-to-use user interface, robust integration capabilities, and a broad range of analytics tools capable of allowing researchers to go deeper into the intricacies of biological systems. By combining disparate datasets seamlessly, WebAtlas allows scientists to expose obscure findings about biology. As the field of single-cell and spatial genomics continues to evolve rapidly, WebAtlas is poised to play a pivotal role in shaping the future of scientific discovery. Its capacity for facilitating the integration and analysis of vast and diverse datasets will enhance our understanding of basic biological processes, hence leading us to potential breakthroughs in medicine & biotechnology.
Article Source: Reference Paper | Full Paper on bioRxiv | All software code has been made publicly available on GitHub.
FAQs
WebAtlas refers to an interface that integrates and interprets data obtained through analyzing single-cell or spatial transcriptomics. It gives researchers a powerful tool for investigating how cells are related to each other within tissues at different positions.
WebAtlas is now available for free access to all users.
The different types of single cell and spatial transcriptomic data which include, scRNA-seq, Visium, Slide-Seq, In Situ, Sequencing (ISS), etc are among the wide arrays of such things that WebAtlas can handle.
Researcher’s connections between cell kinds and gene expression patterns across various modalities are allowed by computational techniques employed by WebAtlas for the integration of single cell and spatial information.
Follow Us!
Learn More:


Anchal is a consulting scientific writing intern at CBIRT with a passion for bioinformatics and its miracles. She is pursuing an MTech in Bioinformatics from Delhi Technological University, Delhi. Through engaging prose, she invites readers to explore the captivating world of bioinformatics, showcasing its groundbreaking contributions to understanding the mysteries of life. Besides science, she enjoys reading and painting.


