
Scientists have questioned the comparison of genes’ organization across various species. Collinearity analysis is a helpful way to go about this task, although it seems complex at first. Collinearity refers to the situation where related genes are found in identical order as well as in the same orientation on different chromosomes. Studying collinearity is one of the main tenets of comparative genomics, which sheds light on how organisms are related evolutionarily and functionally.
Researchers at the Illinois Institute of Technology have come up with a new software pipeline called SYNY, which has made investigating and visualizing collinearity easier. In this blog post, we will explain what functions this software can perform, discuss its pros and cons, and show how it helps researchers assemble genetic puzzles.
Decoding Gene Order Secrets: Why Collinearity Matters?
Consider two recipe books that stand for the genomes of different species. The ingredients (genes) may vary, but some recipes (functional gene clusters) can be surprisingly similar in both books. It is this similarity in the order of genes and their orientation that collinearity analysis helps to identify.
This is why studying collinearity is important:
- Identifying Orthologous Genes: Orthologs are genes that share a common ancestor. Such evolutionary counterparts can be precisely located by a method known as collinearity analysis, thus providing valuable information on functional interactions between genes across species.
- Revealing Genomic Hidden Treasures: However, through the genome annotation process of identifying genes within a genome, some specific ones might not be noticed at all. By comparing gene orders among genomes like this, we have the potential to pick out any missed genes for a given species.
- Telling an Evolution Story: Evolutionary hypotheses can then be informed by the presence or lack of collinearity. For example, highly collinear genomes could indicate a recent common ancestor, while disrupted orders could suggest chromosomal rearrangements during evolution.
SYNY: A User-Friendly Toolkit for Collinearity Analysis
SYNY proves to be a useful tool for researchers studying collinearity. It boasts of a friendly user interface and operates efficiently on standard computer hardware. Here are SYNY’s main features:
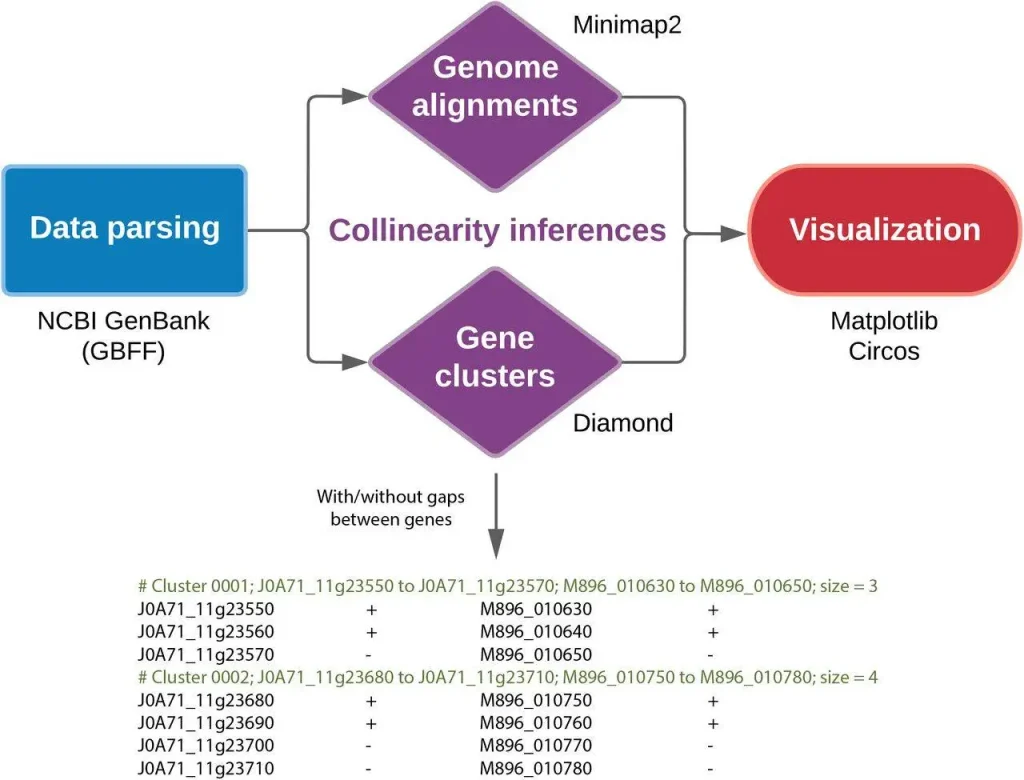
Two analysis approaches: SYNY allows scientists to opt for either of two options in the study of collinearity:
- Sequence Alignment: This approach examines these DNA sequences of whole chromosomes from different species to determine regions with high similarity. In this regard, it is possible to infer conserved regions.
- Gene Order and Orientation Comparison: However, SYNY focuses on the order and orientation of genes themselves. For instance, there may be sets of genes in compared genomes with the same order and direction (called clusters), indicating collinear relationships.
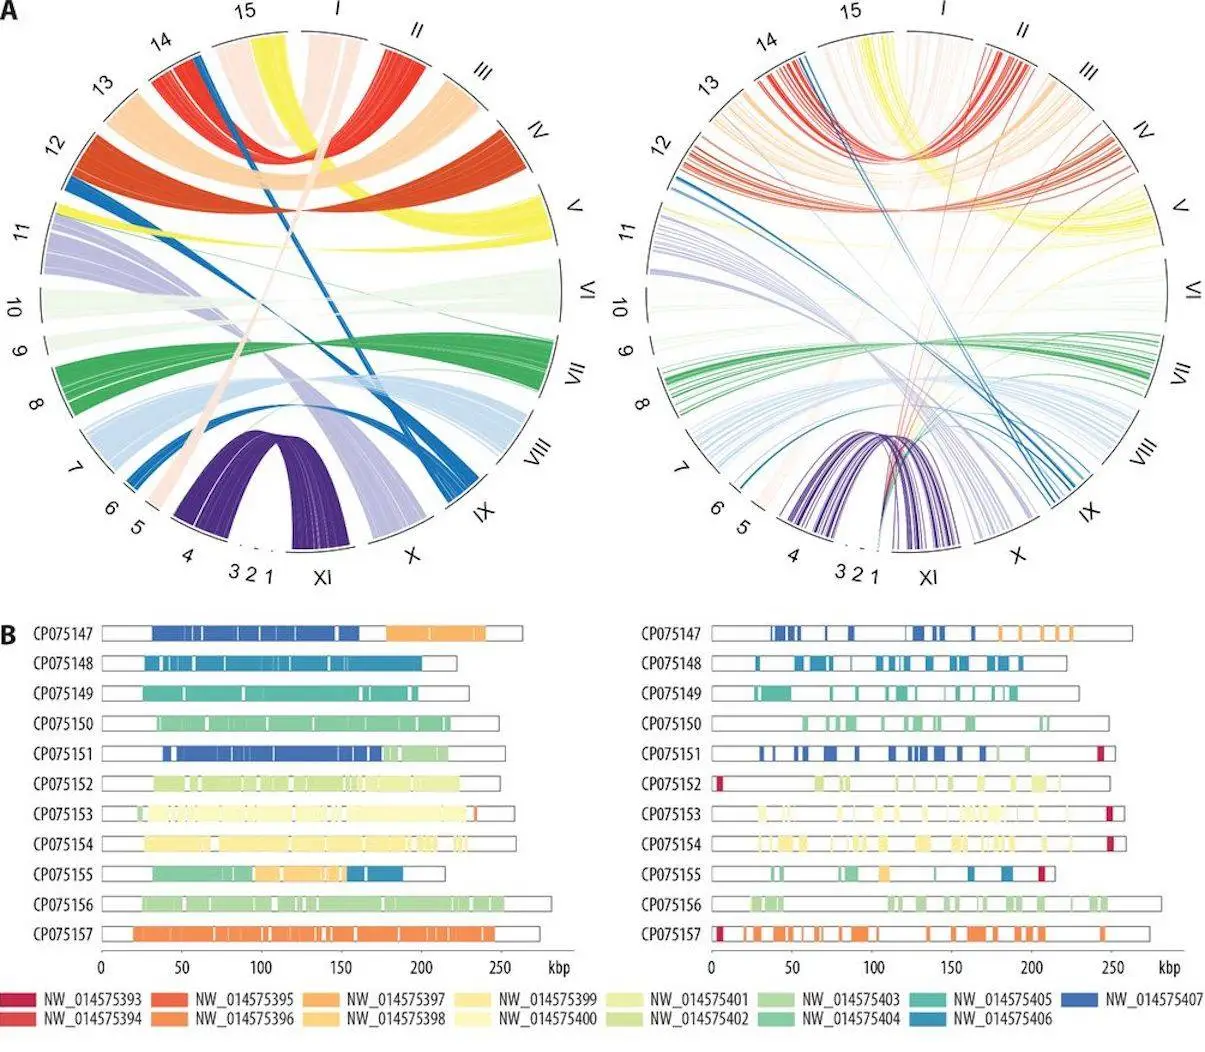
Yet, in addition to this, SYNY is a visualization powerhouse that generates informative visualizations that effectively communicate the results. These include:
- Dotplots: Dotplots, representational graphs, show the areas where two DNA strings are similar. For example, darker dot plots may mean that the sequences have a high identity and thus can be potentially collinear.
- Chromosome Maps (Barplots): These kinds of linear representations compare chromosomes among different species and have various colors or shades for showing collinear segments.
- Circos Plots: These plots are circular diagrams meant to show all the collinearity across a genome. They are accommodating when illustrating complicated rearrangements.
- Heatmaps: SYNY also creates heatmaps that summarize overall synteny between genomes under comparison. These heatmaps provide a quick and easy way to compare collinearity across different places.
SYNY in Action: A Case Study on Microsporidia Genomes
Researchers revealed something interesting when SYNY carried out its analysis. The efficiency of SYNY was demonstrated by looking at microsporidian genomes. Microsporidia are interesting because their genomes are compact but complete and have high sequence divergence between species. Similar results were obtained with two approaches applied in determining genome collinearity, sequence alignment, and gene order based on closely related microsporidia species. In contrast, the sequence alignment method became problematic when comparing distantly related microsporidia due to high sequence divergence. However, the gene order-based approach proved more successful where SYNY identified collinear segments despite extensive differences in sequences.
This case study showed how adaptable and versatile SYNY is. It, therefore, makes it a useful tool for various comparative genomics research that involves both closely and distantly related genomes.
Conclusion
SYNY represents a valuable tool in bioinformatics. SYNY is designed with user-friendliness, resource usage efficiency, and diversified analysis and visualization capabilities, enabling researchers to explore the captivating collinearity area. It facilitates a comprehensive view of gene organization as well as evolutionary relationships, thereby enhancing understanding of genome biology.
Article Source: Reference Paper | SYNY pipeline is available on GitHub under the permissive MIT license.
Important Note: bioRxiv releases preprints that have not yet undergone peer review. As a result, it is important to note that these papers should not be considered conclusive evidence, nor should they be used to direct clinical practice or influence health-related behavior. It is also important to understand that the information presented in these papers is not yet considered established or confirmed.
Follow Us!
Learn More:


Anchal is a consulting scientific writing intern at CBIRT with a passion for bioinformatics and its miracles. She is pursuing an MTech in Bioinformatics from Delhi Technological University, Delhi. Through engaging prose, she invites readers to explore the captivating world of bioinformatics, showcasing its groundbreaking contributions to understanding the mysteries of life. Besides science, she enjoys reading and painting.


