Multi-omics Data Visualization and Chromosomes Annotation with an R Package “ChromoMap”

ChromoMap is a fast and easy-to-use tool for visualizing genomic elements and related data (such as multi-omics data) in relation to their chromosome-by-chromosome occurrence for any genome assembly.
ChromoMap provides customizable displays that allow for the comparison of data individually connected with each strand of a specific chromosome, as well as homologous chromosomes of any size. Individual viewing of multi-omics data in all homologous chromosomes of phased diploid/polyploid genomes is also possible with ChromoMap.
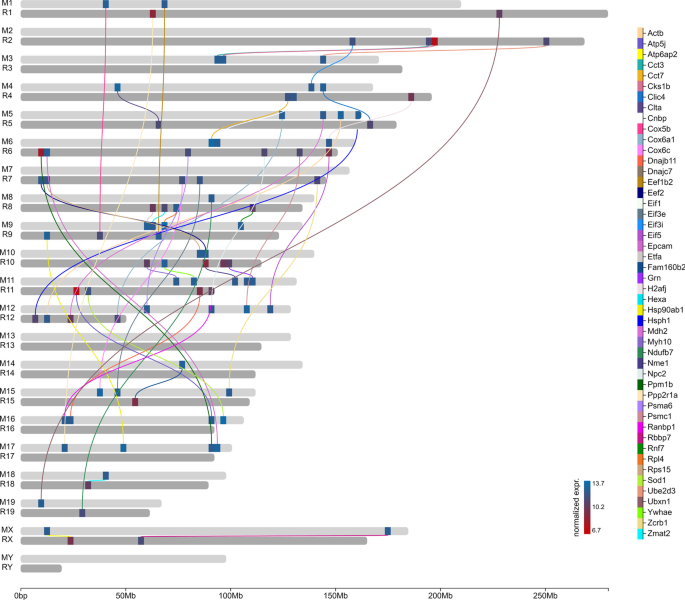
Image Source: ChromoMap: an R package for interactive visualization of multi-omics data and annotation of chromosomes
chromoMap is built by using two languages, R and JavaScript. The features of chromoMap include visualizing options for point and segment annotations, group annotations, labeling, and hyperlinking genomic features.
The package ChromoMap and its documentation are available under the GPL-3 Open Source license from: https://CRAN.R-project.org/package=chromoMap
Story Source: Anand, L., Rodriguez Lopez, C.M. ChromoMap: an R package for interactive visualization of multi-omics data and annotation of chromosomes. BMC Bioinformatics 23, 33 (2022). https://doi.org/10.1186/s12859-021-04556-z